- Bitcoin cash price started a downside correction from the $278 zone against the US Dollar.
- The price is now trading above the $242 zone and the 55 simple moving average (4 hours).
- There was a break above a key bearish trend line with resistance near $236 on the 4-hour chart of the BCH/USD pair (data feed from Coinbase).
- The pair could continue to move down if it breaks the $242 and $240 support levels.
Bitcoin cash price is declining from the $278 zone against the US Dollar, like Bitcoin. BCH/USD must stay above $236 to start a fresh increase.
Bitcoin Cash Price Analysis
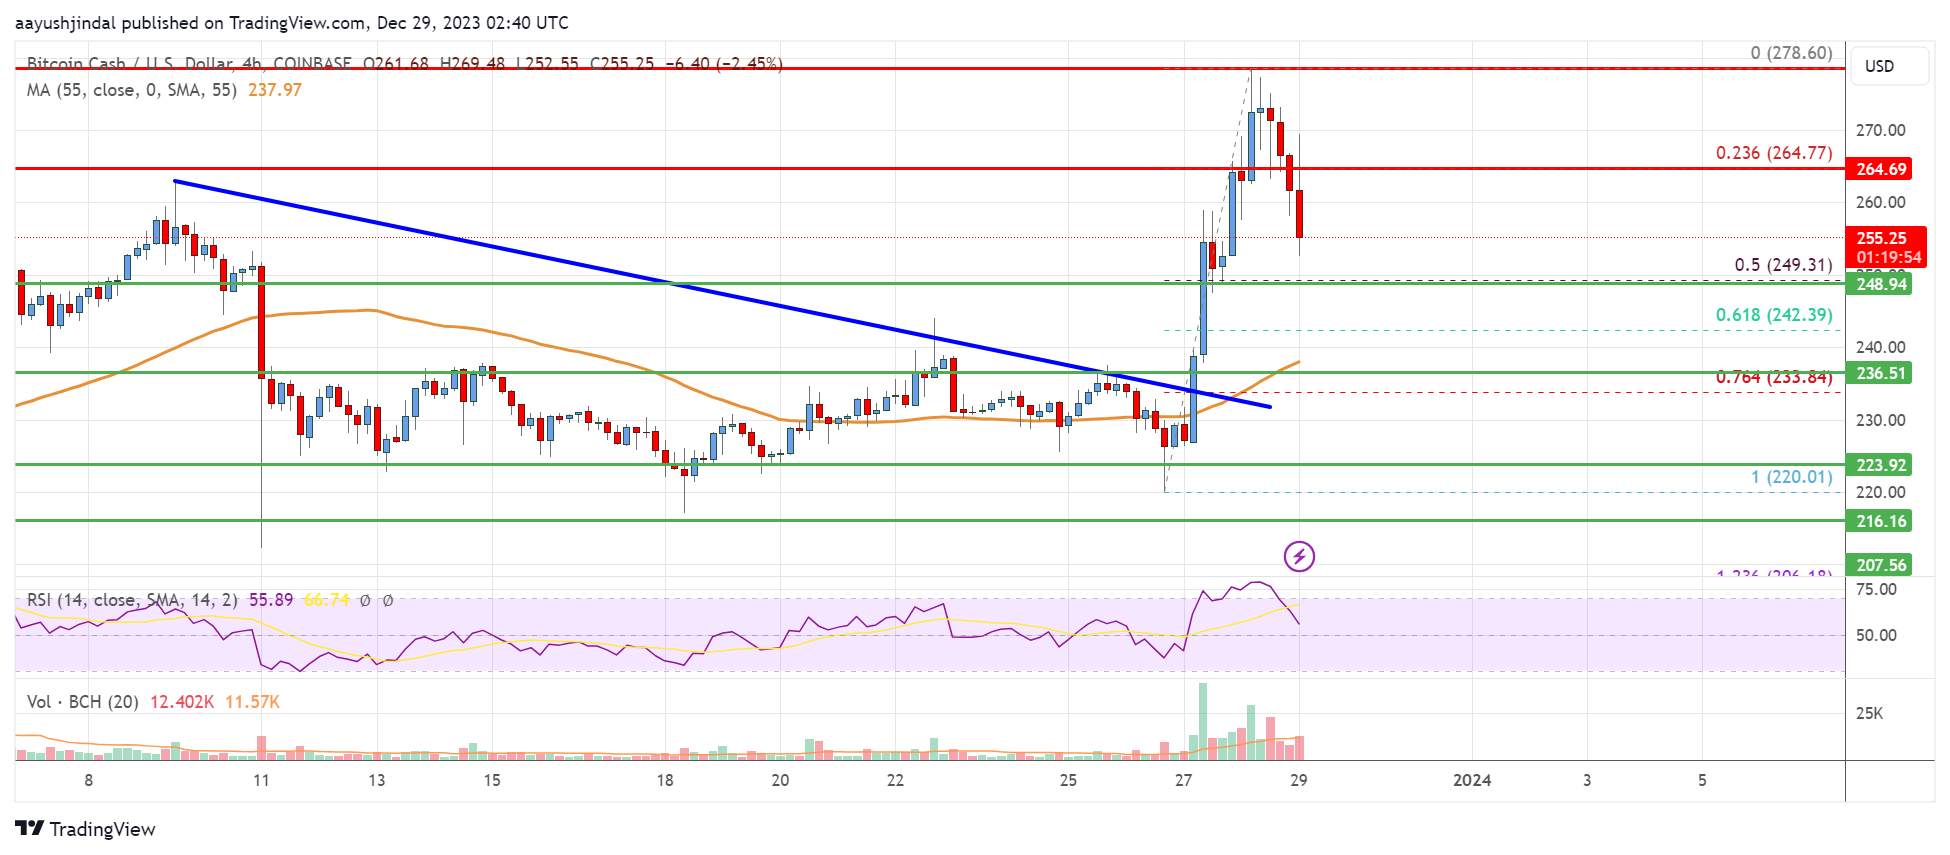
Bitcoin Cash price was able to gain pace for a move above the $250 and $260 resistance levels. There was a break above a key bearish trend line with resistance near $236 on the 4-hour chart of the BCH/USD pair. BCH even traded above the $270 level before the bears appeared.
A high was formed near $278.60 before the price started a downside correction. There was a clear move below the $262 and $260 support levels. The pair traded below the 23.6% Fib retracement level of the upward move from the $220.01 swing low to the $278.60 high.
The bears even pushed the price below the $258 support. It is now trading above the $242 zone and the 55 simple moving average (4 hours). Immediate resistance is near the $260 level.
The main resistance sits near the $265 level. Any more gains above $265 could set the pace for a move toward the $278 level. If there is a move above the $278 resistance, the price could rise toward the $288 zone.
If not, the price might continue lower below $250 or the 50% Fib retracement level of the upward move from the $220.01 swing low to the $278.60 high. Immediate support on the downside is near the $242 zone. The next major support is near the $236 level, below which the bears might aim for $220. The next target for them may perhaps be near the $208 level.
Looking at the chart, Bitcoin Cash price is now trading above the $242 zone and the 55 simple moving average (4 hours). Overall, the price could continue to move down if it breaks the $242 and $240 support levels.
Technical indicators
4 hours MACD – The MACD for BCH/USD is gaining pace in the bearish zone.
4 hours RSI (Relative Strength Index) – The RSI for BCH/USD is declining toward the 50 level.
Key Support Levels – $242 and $240.
Key Resistance Levels – $260 and $265.