- Bitcoin price started a fresh decline below the $62,000 level against the US Dollar.
- The price is now trading below $62,000 and the 55 simple moving average (4 hours).
- There is a key bearish trend line forming with resistance near $62,000 on the 4-hour chart of the BTC/USD pair (data feed from Coinbase).
- The pair could face heavy resistance near the $63,000 zone in the near term.
Bitcoin price is declining below $61,000 against the US Dollar. BTC might extend losses if it stays below the $62,000 resistance zone.
Bitcoin Price Analysis
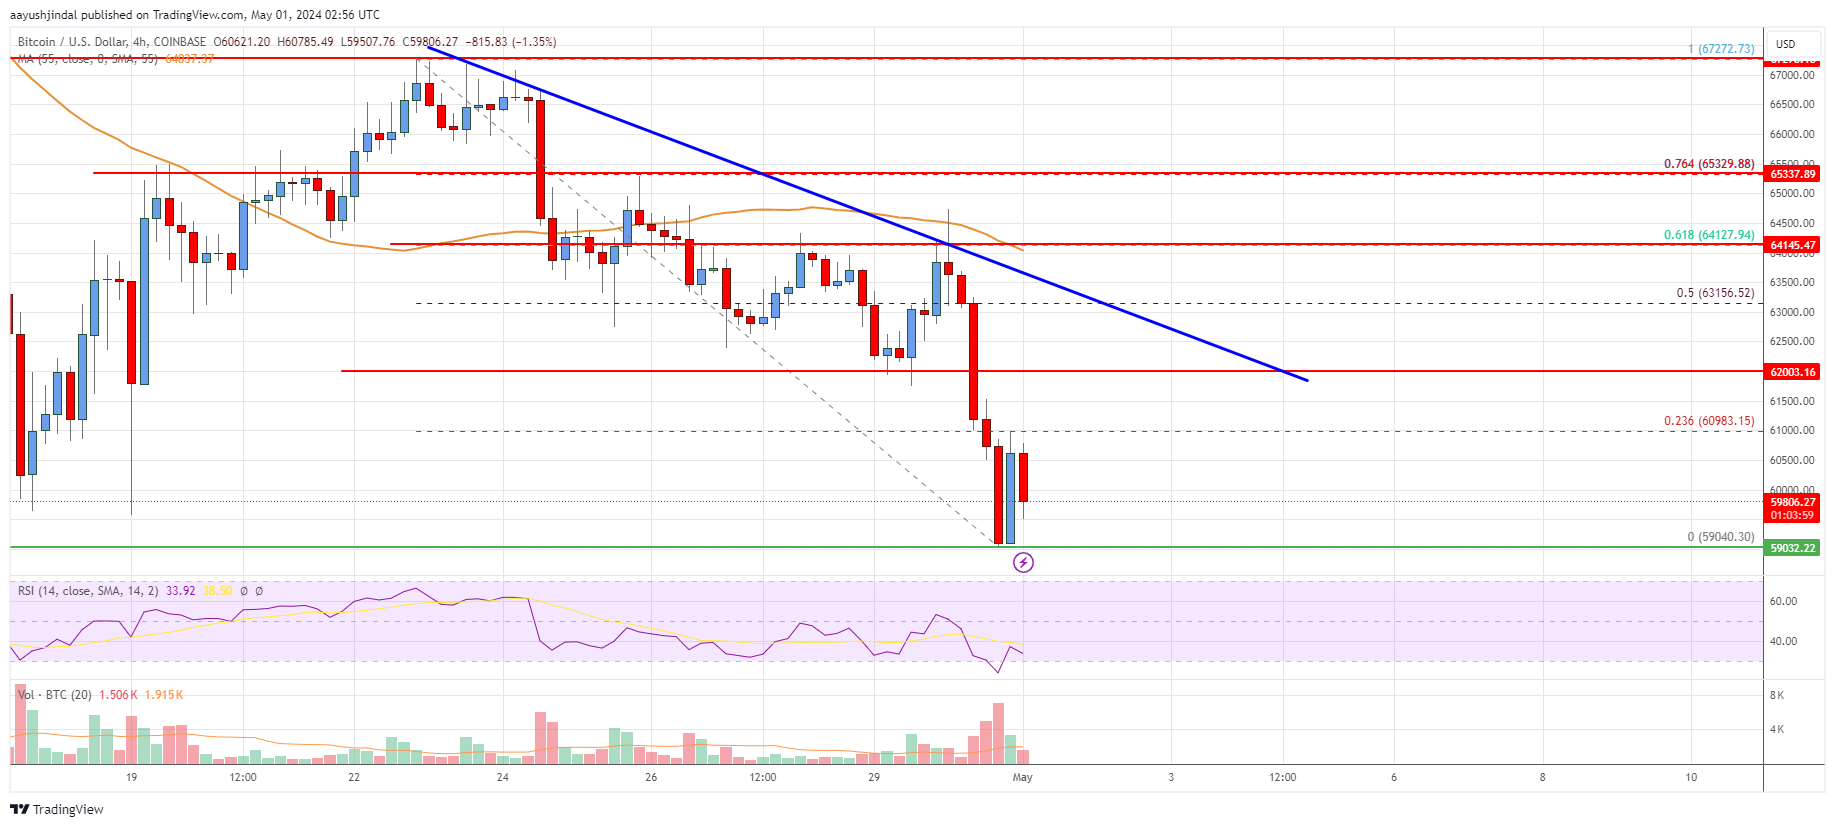
Bitcoin price started a fresh decline below the $64,000 zone. There was a steady decline below the $63,000 and $63,000 levels to move further in a bearish zone.
The bears even pushed the price below the $61,000 and $60,000 support levels. Finally, the price tested the $59,000 zone. A low was formed near $59,040 and the price is now consolidating losses. It is trading below $61,000 and the 55 simple moving average (4 hours).
There is also a key bearish trend line forming with resistance near $62,000 on the 4-hour chart of the BTC/USD pair. Immediate resistance on the upside is near the $61,000 level and 23.6% Fib retracement level of the downward move from the $67,272 swing high to the $59,040 low.
The next major resistance might be near the $63,000 zone or the trend line or the 50% Fib retracement level of the downward move from the $67,272 swing high to the $59,040 low.
A clear move above the $63,000 level might send the price toward $64,000. The main resistance is now forming near the $65,350 zone, above which the price might rise toward the $67,500 level. Any more gains might push the price toward the $70,000 zone.
If there is no upside break, the price might decline below the $59,000 level. The first major support is near $58,500. The next key support is near the $56,800 level, below which the price might accelerate lower. In the stated case, the price could decline toward the $55,500 level.
Looking at the chart, Bitcoin price is clearly trading below $62,000 and the 55 simple moving average (4 hours). Overall, the price could face heavy resistance near the $63,000 zone in the near term.
Technical Indicators
4 hours MACD – The MACD is now gaining momentum in the bearish zone.
4 hours RSI (Relative Strength Index) – The RSI is now below the 50 level.
Key Support Levels – $59,000 and $58,500.
Key Resistance Levels – $61,000, $62,000, and $63,000.
