- Bitcoin price is attempting a fresh increase from the $35,600 zone against the US Dollar.
- The price is now trading below $36,500 and the 55 simple moving average (4 hours).
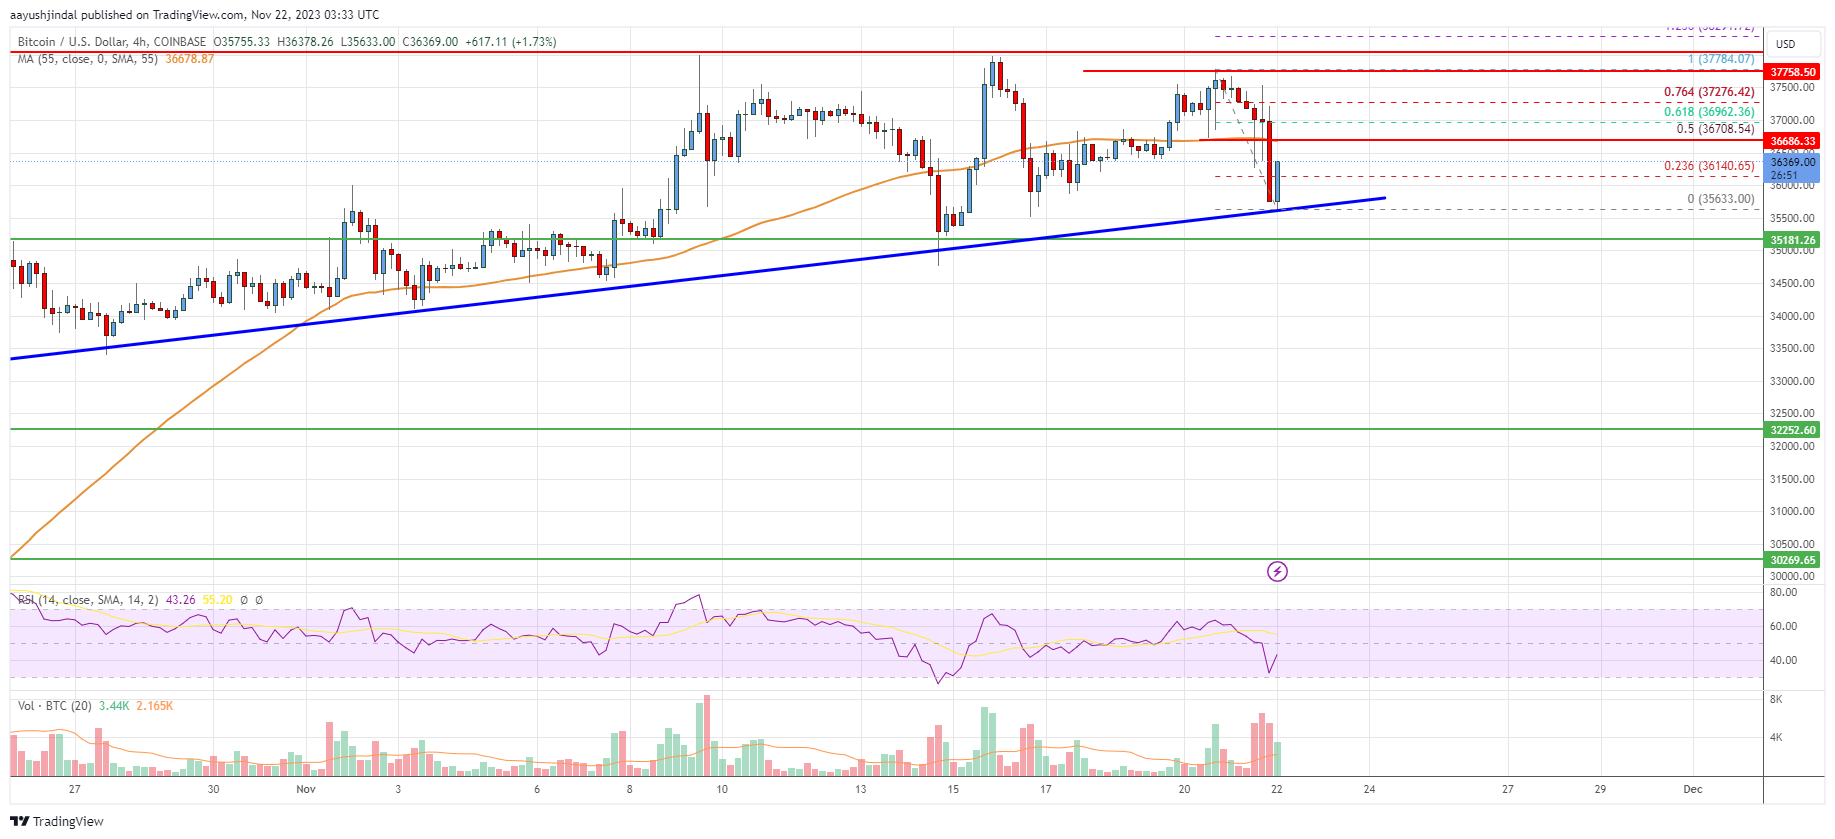
- There is a major bullish trend line forming with support near $35,700 on the 4-hour chart of the BTC/USD pair (data feed from Coinbase).
- The pair could start a fresh increase if it clears the $36,720 resistance zone.
Bitcoin price is rising from $35,600 against the US Dollar. BTC might eye another increase if the bulls remain active above the $35,500 zone.
Bitcoin Price Analysis
Bitcoin price started a fresh decline after it failed to clear the $38,000 resistance. BTC declined below the $37,500 and $37,000 support levels to enter a short-term bearish zone.
There was also a move below the $36,500 level. A low is formed near $35,633 and the price is now attempting a fresh increase. The bulls were able to push the price above the $36,000 level. The price is now above the 23.6% Fib retracement level of the downward wave from the $37,784 swing high to the $35,633 low.
Bitcoin price is now trading below $36,500 and the 55 simple moving average (4 hours). Immediate resistance on the upside is near the $36,500 level.
The next major resistance might be near the $36,720 zone or the 50% Fib retracement level of the downward wave from the $37,784 swing high to the $35,633 low. A clear move above the $36,500 and $36,720 resistance levels might send the price toward $37,500.
Any more gains might push the price toward the $38,000 zone. If there is no upside break, the price might start a fresh decline below the $36,000 level.
The first major support is $35,700. There is also a major bullish trend line forming with support near $35,700 on the 4-hour chart of the BTC/USD pair. The next key support is near the $35,500 level, below which the price might accelerate lower. In the stated case, the price could decline toward the $34,400 level.

Looking at the chart, Bitcoin’s price is trading below $36,500 and the 55 simple moving average (4 hours). Overall, the price could start a fresh increase if it clears the $36,720 resistance zone.
Technical Indicators
4 hours MACD – The MACD is now losing momentum in the bearish zone.
4 hours RSI (Relative Strength Index) – The RSI is now below the 50 level.
Key Support Levels – $35,700 and $35,500.
Key Resistance Levels – $36,500, $36,720, and $37,500.