Key Points
- Bitcoin price is trading in a tiny range, and waiting for a catalyst for the next move.
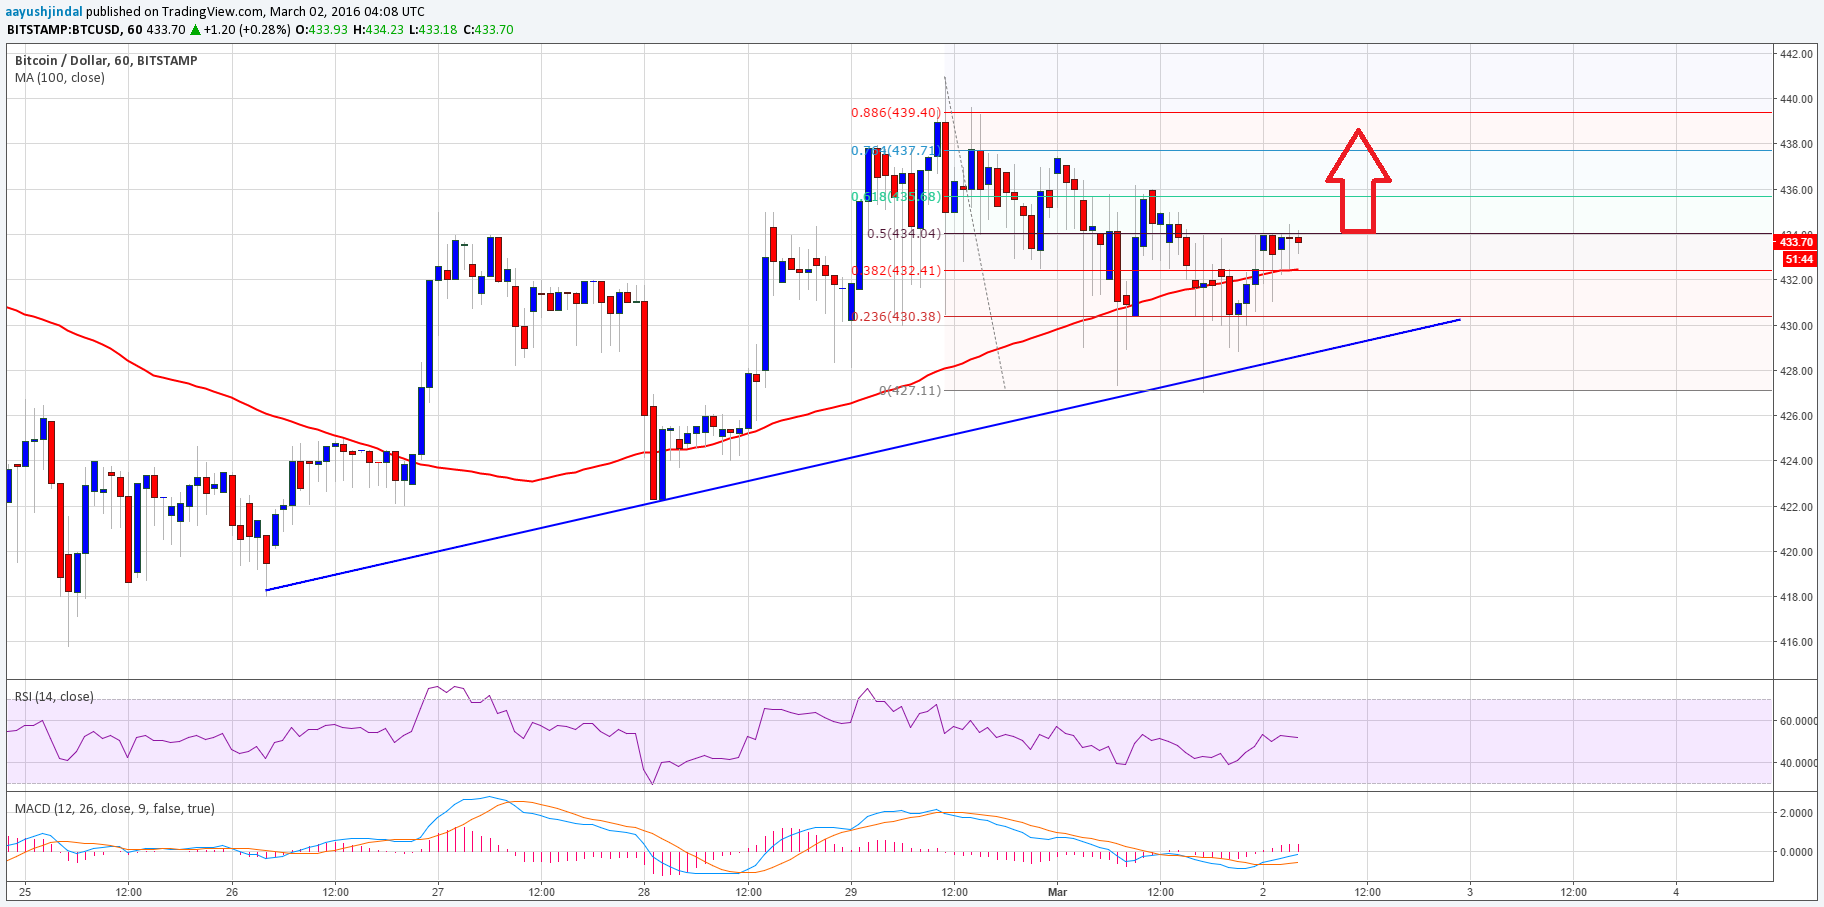
- There is a bullish trend line formed on the hourly chart (data feed from Bitstamp), which might play a critical role for the next move in the short term.
- The last 15-20 hourly candles look very choppy and suggest that the price is struggling to move in one particular direction.
Bitcoin price is elevated at the time of writing, and may move a few points higher as long as it is above the 100 hourly simple moving average.
Bitcoin Price 100 MA Support
Bitcoin price struggle to trade higher is a concern for the bulls, but there are a few positive signs for them. There is a bullish trend line on the hourly chart (data feed from Bitstamp) that continued to act as a barrier for sellers. There were many attempts by the bears to take the price down and break the highlighted trend line support area, but they failed.
There a couple of spikes below the 100 hourly simple moving average (data feed from Bitstamp), but somehow buyers prevented a breakdown. The price is currently above the stated MA, but the momentum is still a concern. The bulls need to gain some momentum if they want to take the price higher. If sellers step and breaks the trend line support, then losses are very likely.
On the upside, a break above the 61.8% Fib retracement level of the last drop from the $440 high to $427 low is needed in order for more gains in the near term.
Looking at the technical indicators:
Hourly MACD – The hourly MACD is in the bullish zone, which is a positive sign for the bulls.
RSI (Relative Strength Index) – The hourly RSI is just above the 50 level, and calling for a break.
Intraday Support Level – $430
Intraday Resistance Level – $440
Charts from Bitstamp; hosted by Trading View
