Key Points
- Bitcoin price continued to trade higher, and our buying dips idea worked well as forecasted in yesterday’s post.
- The price reached our buy target of the $420 level, and currently correcting and consolidating gains.
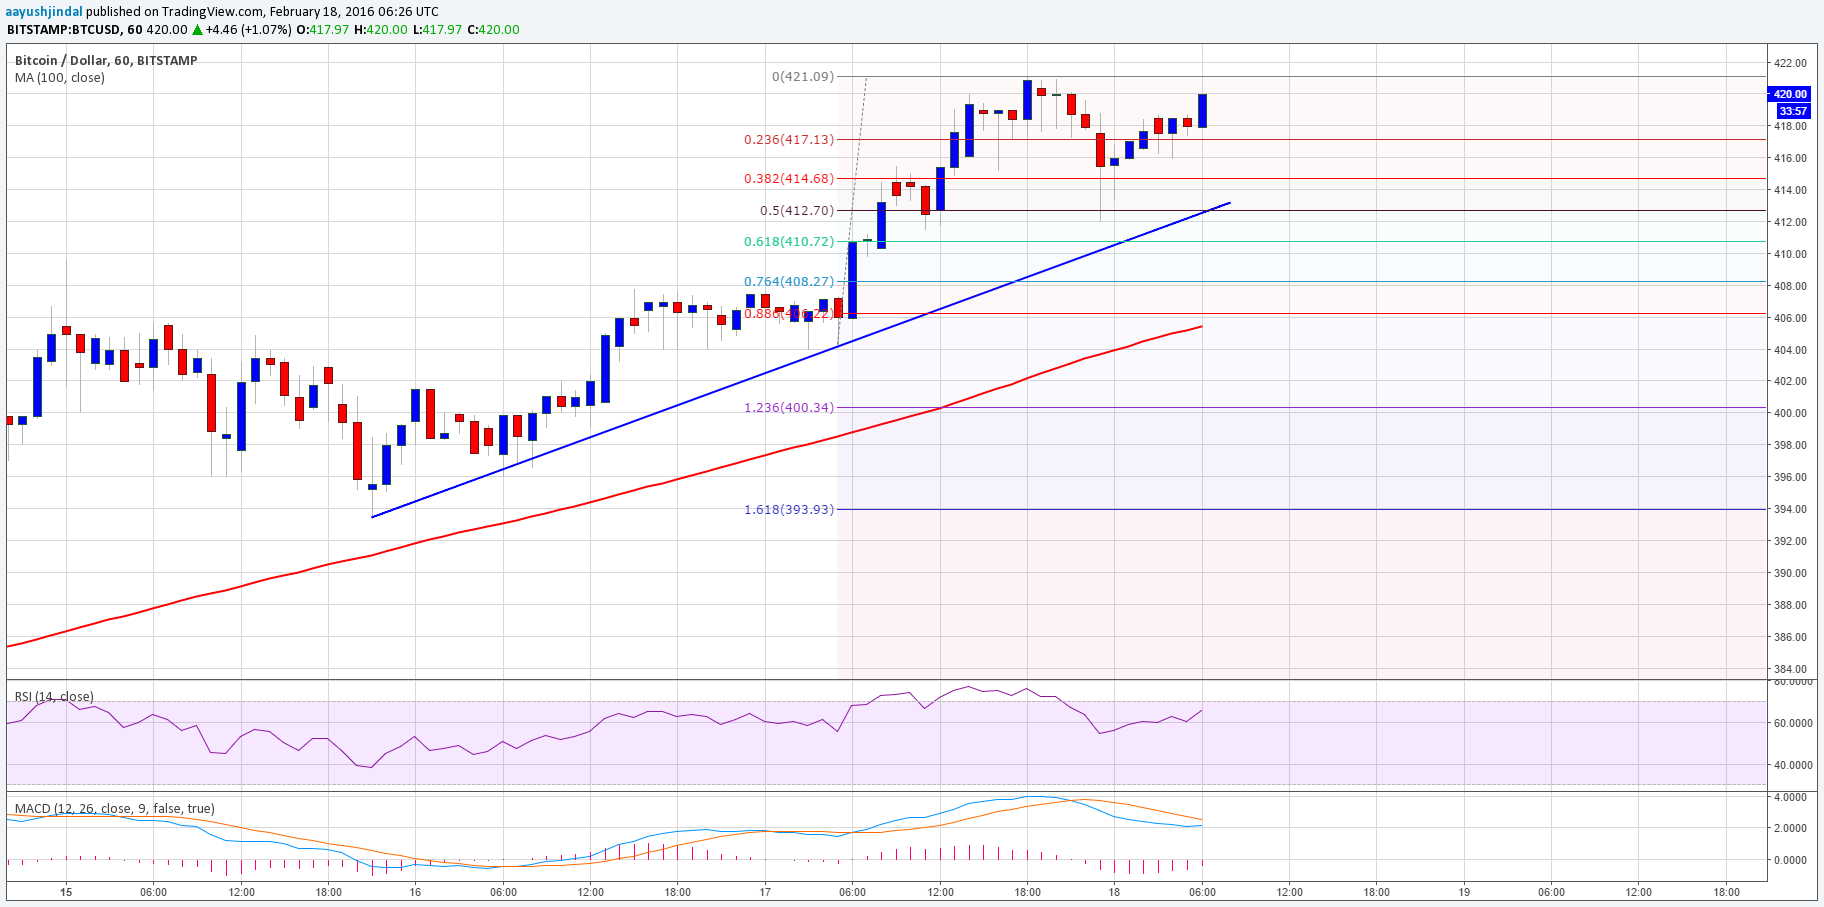
- There is a support trend line formed on the hourly chart (data feed from Bitstamp), which may continue to serve as a support area.
Bitcoin price moved further higher Intraday, and now is looks like there is a chance of a minor correction in the near term.
Bitcoin Price- Wait for a correction?
Bitcoin price managed to clear the $408 level recently, which was highlighted as an important level for both buyers and sellers yesterday. After breaking the stated level, the price moved towards the $420 level, which was the next area of interest and our first buy target. The price traded as high as $421.09 where it found sellers and started to correct down.
The price moved down and tested the 50% Fib retracement level of the last leg from the $404 low to $421 high. Buyers appeared around the stated fib level and pushed the price back higher. There is also a support trend line formed on the hourly chart (data feed from Bitstamp), which acted as a buy zone for buyers.
The price looks like may be heading towards the recent high of $421 once more, but buyers need to be very careful, as this may not be the right time to enter a long trade. As long as the price below the stated level, there is a chance of a minor correction.
So, either we can wait for a correction to enter a buy trade or enter a buy trade if the price breaks above the recent high and closes above it. The price is well above the 100 simple moving average, which is a positive sign.
Looking at the technical indicators:
Hourly MACD – The hourly MACD is about to change the slope to bullish, which is a positive sign.
RSI (Relative Strength Index) – The hourly RSI is above the 50 level, calling for more gains.
Intraday Support Level – $400
Intraday Resistance Level – $408
Charts from Bitstamp; hosted by Trading View
