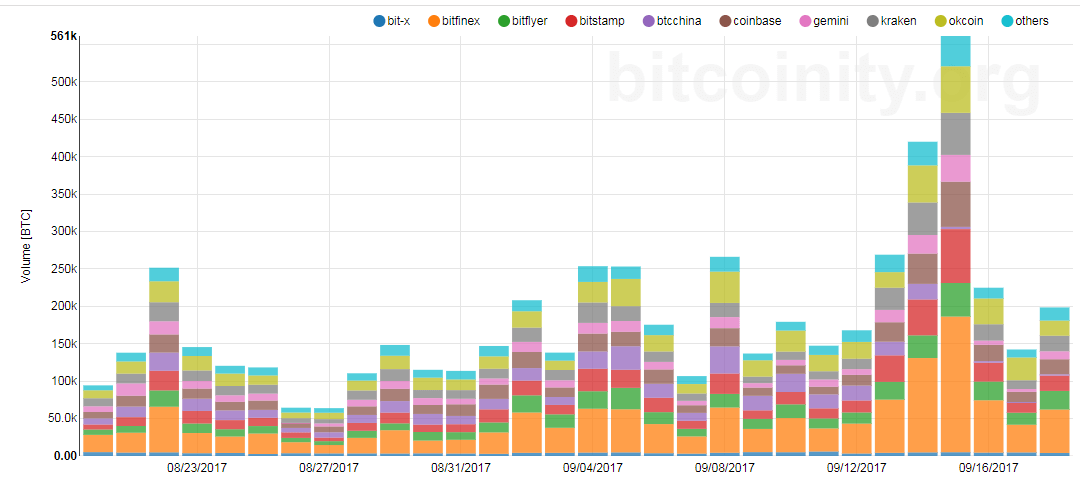
After dropping down to a week low of around $3,004 last Friday, the bearish wave, that has been reigning the market since the beginning of September, was reversed and bitcoin price rose up to $3,961 at the time of writing of this analysis. Thursday trading sessions witnessed a 24 hour trading volume of around 40.5 K bitcoins (as shown on the below trading volume chart from bitcoinity.org); a level that hasn’t been reached since the 22nd of May, 2017. So, will bitcoin price continue rising or will the new upward trend be reversed shortly?

A New 5 Wave Elliott Formation Evident on the 4 Hour BTCUSD Chart:
Let’s examine the 4 hour BTCUSD chart from Bitfinex, while keeping the Fibonacci retracement we plotted during our analysis on September 6th, 2017, and plotting the Williams Alligator , Bollinger bands and MACD indicator (look at the below chart). We can notice the following:
- Right after the week’s low was recorded ($3,004), a “bullish engulfing” pattern was formed on the chart (the 2 candlesticks highlighted by an ellipse on the above chart), signaling reversal of the downtrend that has been evident throughout the market since the beginning of September. The new uptrend was strong enough to take bitcoin price to break through the 50% and 38.2% Fib retracments. The new uptrend will not face significant resistance except around $4,230.9, which corresponds to the 23.6% Fib retracement.
- After the new historical high was recorded on September 2nd, 2017 ($4,983.2), a new 5 wave Elliott formation started forming as shown on the above chart. The new formation is currently compatible only with two of the three basic rules of Elliott formations; wave 2 did not retrace more than 100% of wave 1 and wave 3 is not the shortest impulse wave (mostly, it will end up being the longest wave). Wave 4 should not overlap wave 1, so the climax of wave 4 will most probably be even lower than the 23.6% Fib retracement at around maybe $4,000 near the bottom of wave 1.
- The 5th wave of the Elliott formation has began forming. This is evident by the “bearish piercing” pattern that signaled reversal of the corrective uptrend of the 4th wave. Also, the uptrend was halted right after the candlesticks began forming close to the upper Bollinger band. We expect to see the 5th wave take bitcoin price during the upcoming week all the way down below $3,000 to complete the Elliott formation.
- The fourth wave can continue on pushing bitcoin price upwards towards the 23.6% Fib retracement, before the 5th wave ensues, especially that the Williams Alligator and MACD indicator are both still bullish.
Conclusion:
Bitcoin price began recovering during the past week, scoring a week high of $4,120. Our technical analysis predicts reversal of the new uptrend shortly during the upcoming week, to complete a 5 wave Elliott formation on the 4 hour BTCUSD chart. However, bitcoin price may continue rising towards the $4,230.9 price level (23.6% Fib retracment) before the market’s bears take over the market again.
Charts from Bitfinex, hosted on Tradingview.com