Bitcoin price surged last week to score a high of $2,635 last Tuesday, before dropping down to $2,497 on Bitfinex at the time of writing of this analysis. The market’s bulls failed to push price up to test the resistance around $2,691, as we expected during our previous weekly analysis, and the uptrend was reversed around $50 short of this crucial resistance level. Price has been moving around the $2,508.17 price level for the past 24 hours or so and it seems that this level is representing a relatively strong resistance level.
So, where will bitcoin price be heading during the upcoming week?
New Uptrend Forming on the 4 Hour BTCUSD Chart:
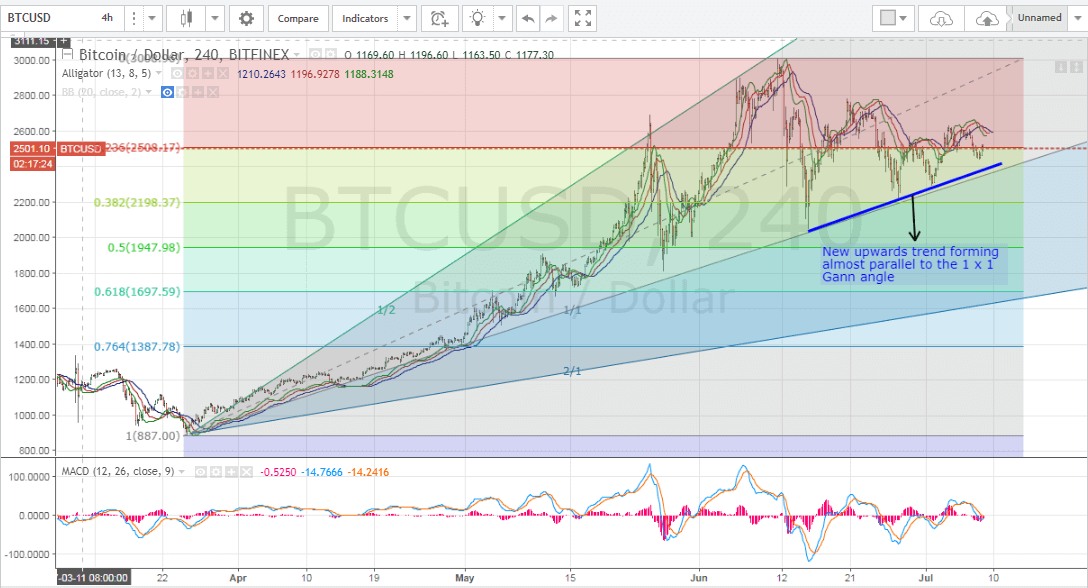
By examining the 4 hour BTCUSD chart from Bitfinex, while executing the MACD and Williams Alligator indicator, we can note the following (look at the below chart):

- We can now draw a Fibonacci retracement that extends between the low recorded on the 24th of March ($887.44) and the high recorded on the 11th of June ($3009). We can also plot a Gann angle placement by connecting the low recorded on the 24th of March with the high recorded on the 5th of June.
- Now, we can clearly see that bitcoin price is currently testing the resistance around $2508.17 which corresponds to the 23.6% Fibonacci retracement. If the market’s bulls are successful in breaking through this resistance level, we can see bitcoin price head towards $3000, during the upcoming week, as there is no significant resistance all the way towards this price level except around $2,691.
- As noted on the above chart, a new uptrend line can now be spotted starting from the 15th of June (the blue upwards trend line). Repeated bullish waves followed by downwards price correction movements can be noted with upwards rise of the low recorded during each successive wave. The new uptrend is almost parallel to the 1 x 1 Gann angle, which reflects market stability at this price level.
- The SMAs of the Williams Alligator are still exhibiting a bearish signal. A strong bullish wave won’t probably be noted until the SMAs change their alignment to exhibit a bullish signal.
- The MACD indicator is also exhibiting a bearish signal as it is sloping downwards around the zero level, so its value will most probably drop into the negative territory within the next 24 hours or so. Also, the red negative trend line is travelling above the blue positive trend line. I recommend refraining from investing in any new long positions, until a bullish signal could be noted via the MACD indicator.
Conclusion:
Bitcoin price recorded a high of $2,635 last week, before dropping down to around $2,500 at the time of writing of this analysis. Right now, bitcoin price is testing the resistance around $2,508.21 which corresponds to the 23.6% Fib retracement level. If this crucial resistance level is successfully broken, we can see bitcoin price rise to test the resistance around $2,691 within the upcoming week.
Chart from Bitfinex, hosted on Tradingview.com