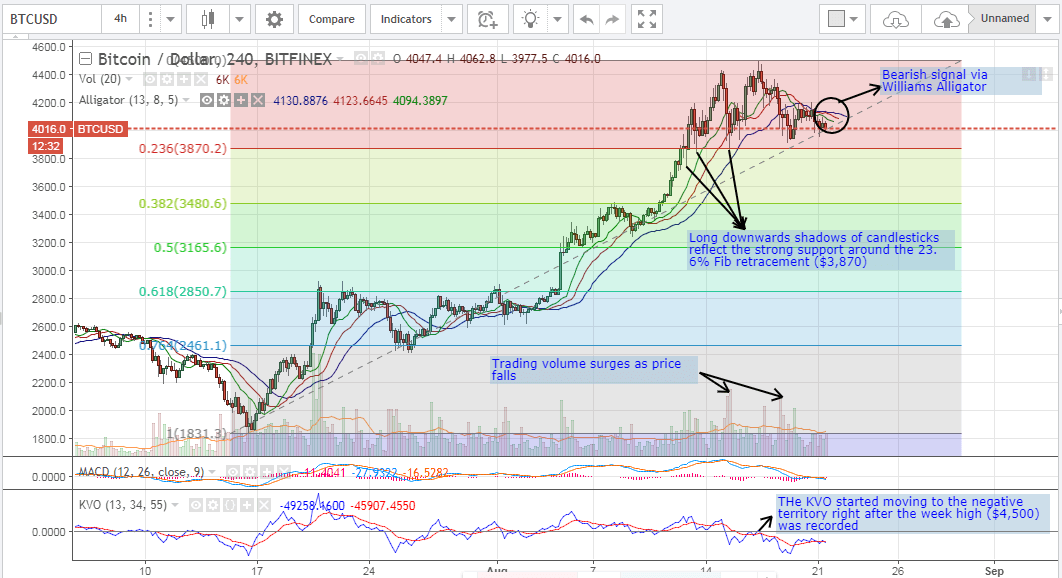
Bitcoin price continued surging during the first half of last week’s trading sessions, to record a new historical high of $4,500 last Thursday, before the bears have taken over the reins of the market pulling price downwards to $3,904 on Saturday. The BTCUSD 24 hour trading volume exceeded $373 million on Thursday, as per data from blockchain.info. The decline in bitcoin price was associated with a sharp rise in the 24 hour trading volume, which reflects weakening of the bullish wave that has been dominating the market since the beginning of the month, as speculators and traders are closing their long positions to collect their profits.
So, where can we expect bitcoin price to be heading during the upcoming week?
Downwards Price Correction Is Prominent On the 4 Hour BTCUSD Chart:
Let’s take a look at the 4 hour BTCUSD chart from Bitfinex, while executing the Williams Alligator indicator, the MACD indicator and the Klinger Volume Oscillator (KVO) (look at the below chart). We can notice the following:

- We can now plot a Fibonacci retracement that extends between the low recorded on the 15th of July ($1,831.3) and the high recorded on the 17th of August ($4,500). As shown on the above chart, the 23.6% Fib retracement, which corresponds to the $3,870.2 price level, represents a strong support level that prevented further price drop several times during last week’s trading sessions, as evidenced by the long downwards shadows of the candlesticks near this price level. As such, we expect bitcoin price to drop towards this level, before the market’s bulls could be able to take the upper hand again.
- The 24 hour BTCUSD trading volume has been higher than $200 million since last May, as shown on the below chart from blockchain.info, which accompanied the bullish wave that has been controlling the market during this period. We can also note a couple of surges in the 24 hour trading volume, that accompanied the price declines that were witnessed during last week’s trading sessions (as shown on the above BTCUSD chart). As price has began to range, with relatively little price movements as compared to the previous week, along with a rise in the trading volume, this most probably confirms reversal of the upwards trend, so we expect price to continue dropping towards the 23.6% Fib retracement ($3,870.2) during the upcoming week.
- The Klinger Volume Oscillator (KVO) has been mostly in the positive territory throughout the bullish wave that started in the middle of July. Also, note that short periods of price decline were accompanied by a migration of the value of the KVO towards the negative territory. Right after the week’s high ($4,500) was recorded, the KVO moved into the negative territory; this confirms reversal of the bullish trend
Klinger Volume Oscillator (KVO): is a volume indicator that combines the buying, or accumulation, and the selling, or distribution, volumes of a certain asset during a specific time period. Fluctuation between the negative and positive territories can be used, in combination with other trading signals, to predict trend reversals.
- The MACD indicator is sloping downwards and has just moved into the negative zone. This confirms reversal of the bullish wave, especially that the MACD was mostly in the positive zone all through the recent bullish trend. The Williams Alligator indicator has also just exhibited a bearish signal with the red SMA above the green SMA and the blue SMA above both.
Conclusion:
Bitcoin price started dropping right after a new historical high was recorded last week ($4,500). Our technical analysis predicts reversal of the bullish trend, so we can see bitcoin price drop towards the 23.6% Fib retracement level around ($3,870.2) during the upcoming week.
Charts from Bitfinex and Blockchain.info