- ADA price is attempting a fresh increase above the $0.250 zone against the US Dollar.
- The price is now trading above $0.250 and the 55 simple moving average (4 hours).
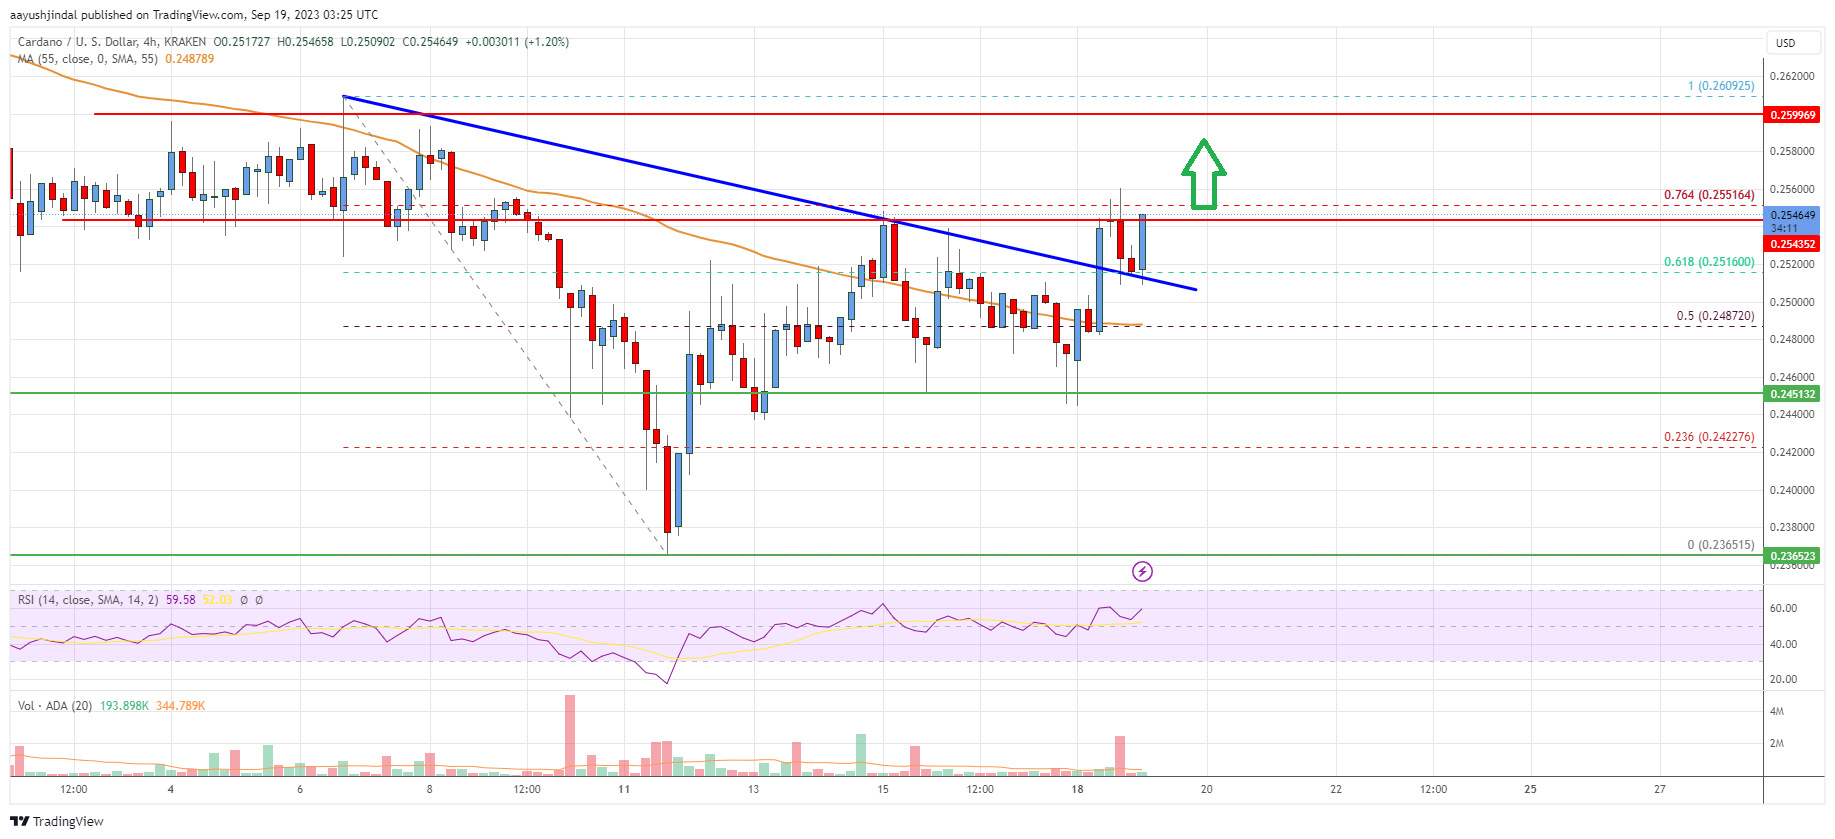
- There was a break above a key bearish trend line with resistance near $0.2515 on the 4-hour chart (data feed via Coinbase).
- The price could gain bullish momentum if it clears the $0.2555 and $0.2600 levels.
Cardano price is holding the $0.250 support against the US Dollar, like Bitcoin. ADA price could gain bullish momentum if it clears the $0.260 resistance.
Cardano Price Analysis
This past week, Cardano price saw a decent upward move from the $0.236 support against the US Dollar. The ADA/USD pair was able to climb above the $0.245 and $0.250 resistance levels.
During the increase, the bulls pushed the price above the 50% Fib retracement level of the downward move from the $0.2609 swing high to the $0.2365 low. Besides, there was a break above a key bearish trend line with resistance near $0.2515 on the 4-hour chart.
ADA is now trading above $0.250 and the 55 simple moving average (4 hours). On the upside, immediate resistance is near the $0.2555 zone. It is close to the 76.4% Fib retracement level of the downward move from the $0.2609 swing high to the $0.2365 low.
The next major resistance is near the $0.260 level. A clear move above the $0.260 resistance might start a steady increase. In the stated case, the price may perhaps rise toward the $0.275 resistance or even $0.288 in the near term.
On the downside, immediate support is near the $0.252 level. The next major support is near the $0.250 level or the 55 simple moving average (4 hours).
A clear move below the $0.250 level might send the price toward the $0.245 level. Any more losses might send the price toward the $0.236 support, below which the bears could aim for a test of $0.220.

The chart indicates that ADA price is now trading above $0.250 and the 55 simple moving average (4 hours). Overall, the price could gain bullish momentum if it clears the $0.2555 and $0.2600 levels.
Technical Indicators
4 hours MACD – The MACD for ADA/USD is now gaining pace in the bullish zone.
4 hours RSI – The RSI for ADA/USD is now above the 50 level.
Key Support Levels – $0.250 and $0.245.
Key Resistance Levels – $0.2555 and $0.260.