- EOS price started a downside correction from the $0.620 zone against the US Dollar.
- The price is now trading below $0.600 and the 55 simple moving average (4 hours).
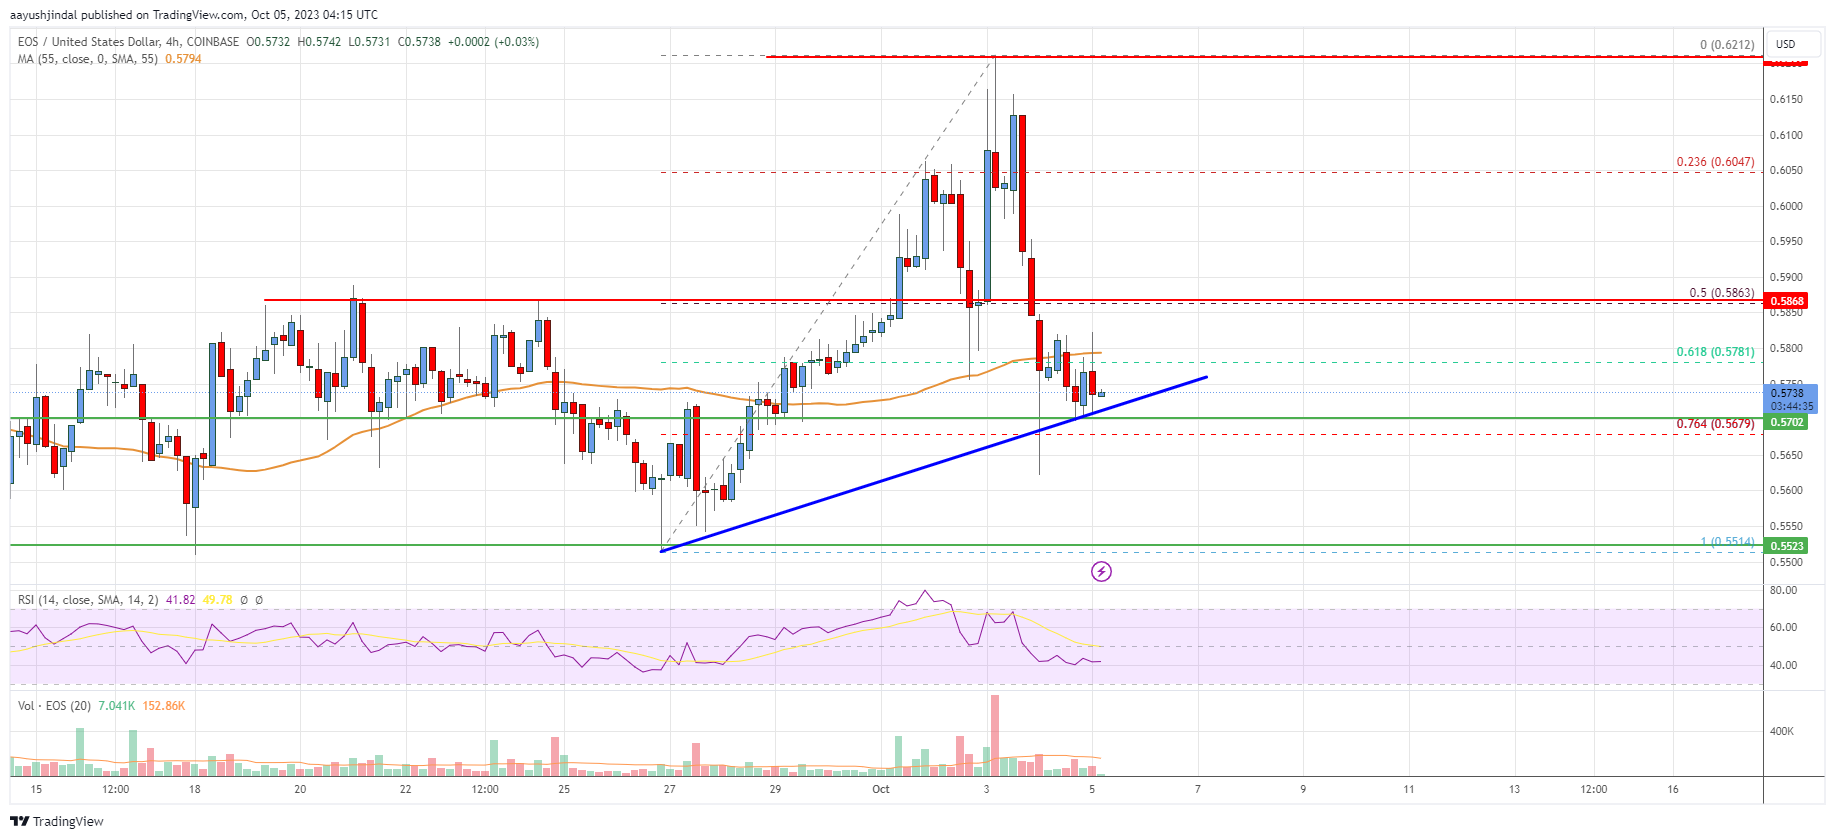
- There is a key bullish trend line forming with support near $0.572 on the 4-hour chart of the EOS/USD pair (data feed from Coinbase).
- The pair could continue to move down if it stays below the $0.586 and $0.600 resistance levels.
EOS price is declining below $0.600 against the US Dollar, like Bitcoin. The price could attempt a fresh increase unless there is a break below $0.565.
EOS Price Analysis
Earlier this month, EOS price climbed higher above the $0.588 resistance zone against the US Dollar. The price surpassed the $0.600 level and settled above the 55 simple moving average (4 hours).
A high was formed near $0.6212 before the price started a downside correction. The price declined below the $0.588 support zone. There was a drop below the 50% Fib retracement level of the upward move from the $0.5514 swing low to the $0.6212 high.
However, the bulls were active near the $0.565 support. The price is also stable above the 76.4% Fib retracement level of the upward move from the $0.5514 swing low to the $0.6212 high.
Besides, there is a key bullish trend line forming with support near $0.572 on the 4-hour chart of the EOS/USD pair. It is now trading below $0.585 and the 55 simple moving average (4 hours). On the downside, immediate support is near the $0.572 level.
The next key support is near the $0.565 level. If there is a downside break below the $0.565 support, the price could revisit the $0.550 support.
On the upside, immediate resistance is near the $0.585 level. The first major resistance is near the $0.600 level, above which the price could rise steadily toward the $0.62 level. Any more gains might send the price toward the $0.65 level.

Looking at the chart, EOS price is now trading below the $0.585 level and the 55 simple moving average (4 hours). Overall, the price could continue to move down if it stays below the $0.585 and $0.600 resistance levels.
Technical indicators
4 hours MACD – The MACD for EOS/USD is losing pace in the bearish zone.
4 hours RSI (Relative Strength Index) – The RSI is now below the 50 level.
Major Support Levels – $0.572 and $0.565.
Major Resistance Levels – $0.585 and $0.600.