

Ethereum is now one of the best performing assets on all fronts, with analysts comparing it to a “90s tech stock”. $4.5k next?
Ethereum is back in the spotlight after delivering its best monthly performance in three years. In July alone, the second-largest cryptocurrency by market cap climbed 56% and closed the month at $3,862.
This means that it rose all the way up from $2,468 on July 1, according to CoinGecko.
This powerful move was largely fueled by strong inflows into spot Ether ETFs, and has prompted one Bloomberg analyst to compare Ether’s trajectory to that of 1990s tech stocks.
ETF Inflows Push Ether to Three-Year High
ETFs have been an important part of Ether’s recent rally so far. This market sector saw over 19 consecutive days of continuous net inflows in July, drawing in over $5.37 billion from investors.


While this happened, BlackRock’s iShares Ethereum ETF hit a major milestone and crossed the $10 billion mark in AUM just 251 days after launch. That makes it the third-fastest ETF to do so in history.
What’s even more surprising is that for six days in a row during July, Ether ETFs pulled in more funds than Bitcoin ETFs. This is a rare occurrence that shows that market sentiment is shifting.
ETH Price Resembles ‘90s Tech Stocks
Eric Balchunas, Bloomberg’s Senior ETF Analyst, described Ether’s rise as similar to the explosive growth of tech stocks in the 1990s. He pointed out that the rising adoption and network activity, set Ether apart from Bitcoin’s “digital gold” image.
Ether Starting to Look Like '90s Tech Stock as ETFs Catch Fire.. new from me today on Ether ETFs' breakout returns/flows, a reminder that alt coin ETFs more like fledgling tech stocks in the '90s vs bitcoin's 'new gold' appeal. Two blockchains, but very dif trades. pic.twitter.com/FaJKDKuMl1
— Eric Balchunas (@EricBalchunas) July 30, 2025
Balchunas noted that institutional buyers are warming up to Ethereum as a growth asset rather than just a speculative token. This sentiment is supported by the market’s growing confidence in Ethereum’s future as a programmable platform for defi and beyond.
Futures Volume and Liquidations Point to More Upside
Another strong signal in Ether’s favor is the growing volume of its perpetual futures contracts. For the first time in the last three years, Ether has beaten Bitcoin in futures volume dominance. This is a clear sign that traders are more and more betting on ETH.

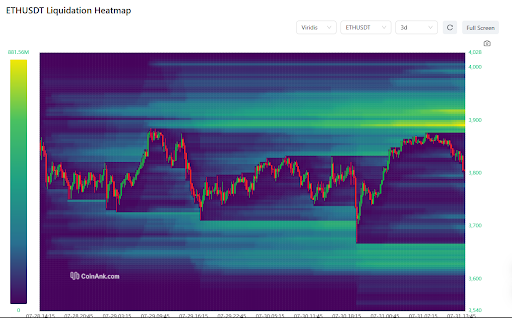
Market watchers are also paying attention to a large cluster of short liquidations just above the $4,000 level. If ETH can break above this psychological barrier, nearly $930 million in short positions could be wiped out, and could fuel a surge toward $4,500.
Some traders believe Ether is approaching a “just send it” moment, where market strength could override short-term technical issues.
Ethereum Bearish Divergence Signals Short-Term Risks
However, not all indicators are bullish though. Ether’s recent highs have not been confirmed by its relative strength index (RSI), which is now showing signs of bearish divergence. This usually indicates that buying pressure is weakening, even as prices continue to rise.

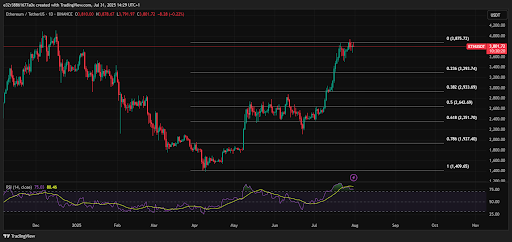
Zooming in on the four-hour and daily charts, analysts have pointed out patterns that could be signalling a local correction. If ETH fails to break through $4,000 with strong volume, it may pull back to test support levels near $3,700.
Overall, the Fibonacci retracement tool shows that if Ethereum successfully breaks above the $4,000 zone with strong volume, it could be open to testing the $4,500 zone at least.
In a worst-case scenario, Ether could drop to the $3,200–$3,300 range. This area represents a “fair value gap” that hasn’t been tested during the recent rally.
Overall, the next few weeks will be very important in determining whether the bullish strength holds, or fades under pressure.


