Key Highlights
- Litecoin price was stalled right around $3.50 as forecasted yesterday and moved down.
- The resistance trend line on the hourly chart with data feed from Bitfinex proved worth and pushed the price down.
- Currently, a bullish trend line is formed on the same chart, which is acting as a support area.
Litecoin price is failed to trade above $3.50 and traded down. It is currently testing an important trend line and support area.
Can it hold?
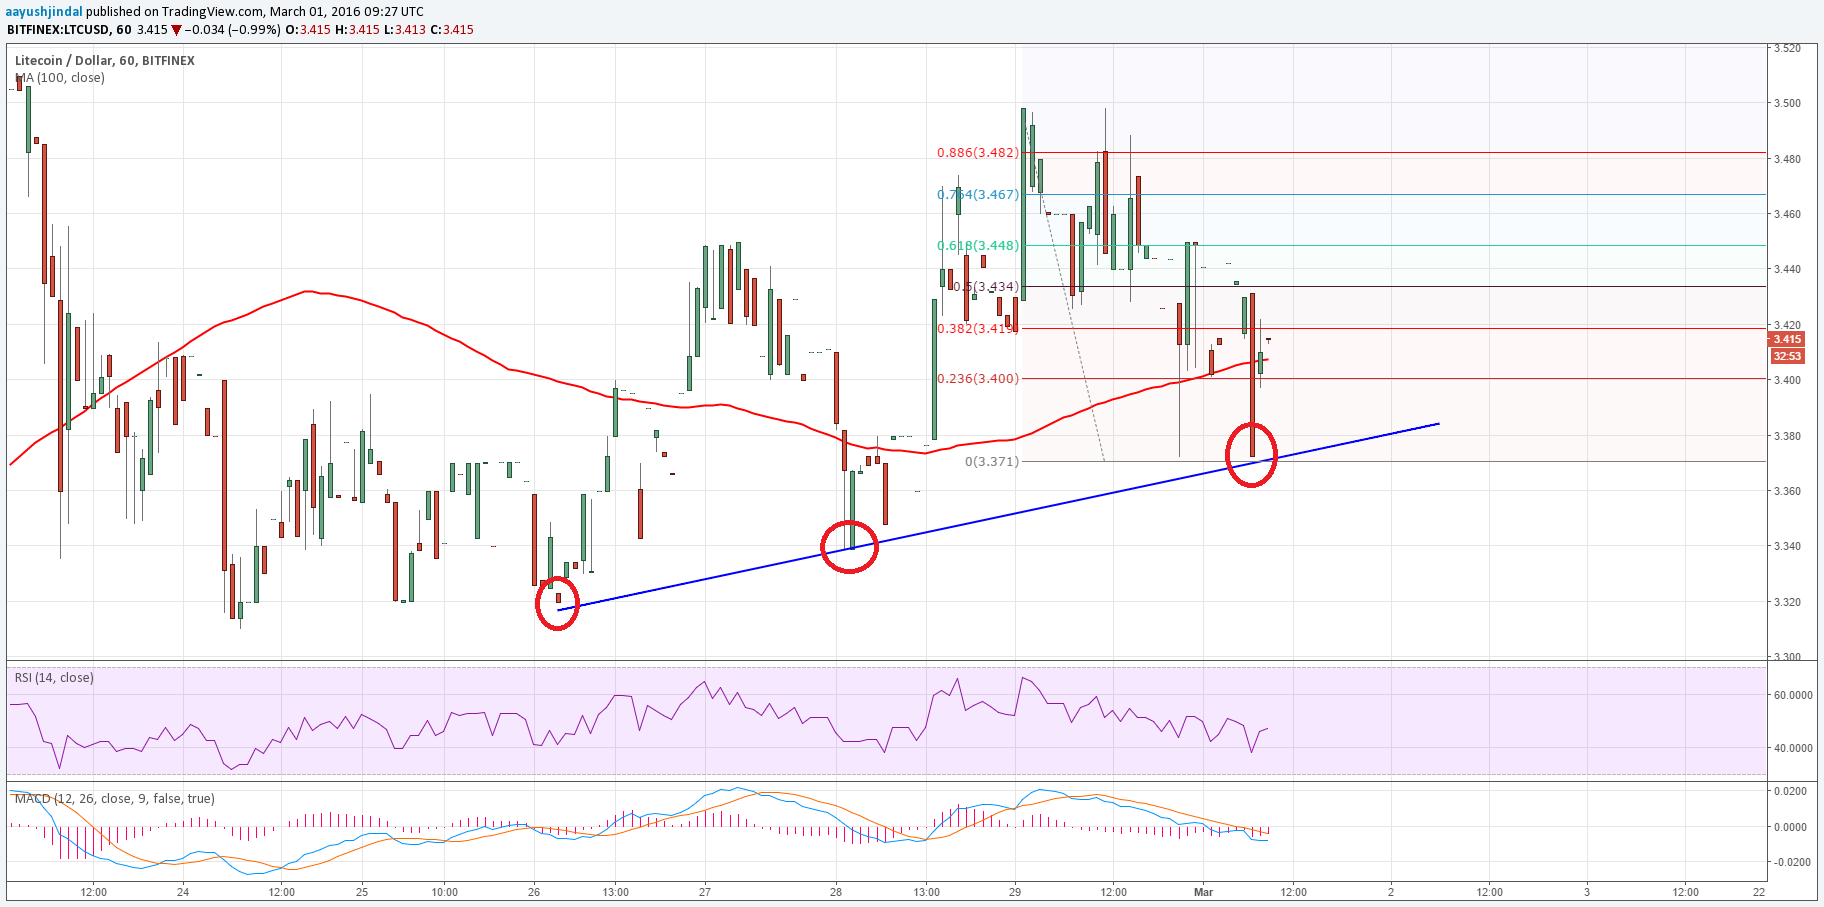
Litecoin price traded higher yesterday, but failed to break an important resistance area at $3.50. There was a bearish trend line as highlighted in yesterday’s post, which acted as a barrier and pushed the price down. There was a downside reaction, which found support near a bullish trend line on the hourly chart with data feed from Bitfinex.
The price traded as low as $3.37 and currently struggling to hold the ground. The highlighted trend line and support area holds the key for Litecoin price in the near term. As long as it is above it, there is a chance of a minor recovery. An initial resistance may be around the 23.6% Fib retracement level of the last drop from the $3.49 high to $3.37 low.
The 100 hourly simple moving average may play a major role in the short term, and the bulls might find it hard to take the price above it. The next hurdle on the upside could be around the 61.8% Fib retracement level of the last drop from the $3.49 high to $3.37 low. On the downside, a break below trend line may take the price towards $3.25.
Looking at the indicators:
Hourly MACD – The MACD is in the bearish zone, calling for a breakdown.
Hourly RSI – The RSI is also below the 50 level, which is another bearish sign.
Intraday Support Level (HitBTC) – $3.35
Intraday Resistance Level (HitBTC) – $3.42
Charts from Bitfinex; hosted by Trading View
