- Stellar lumen price is attempting a fresh increase from the $0.1240 zone against the US Dollar.
- XLM price is now trading above $0.1300 and the 55 simple moving average (4 hours).
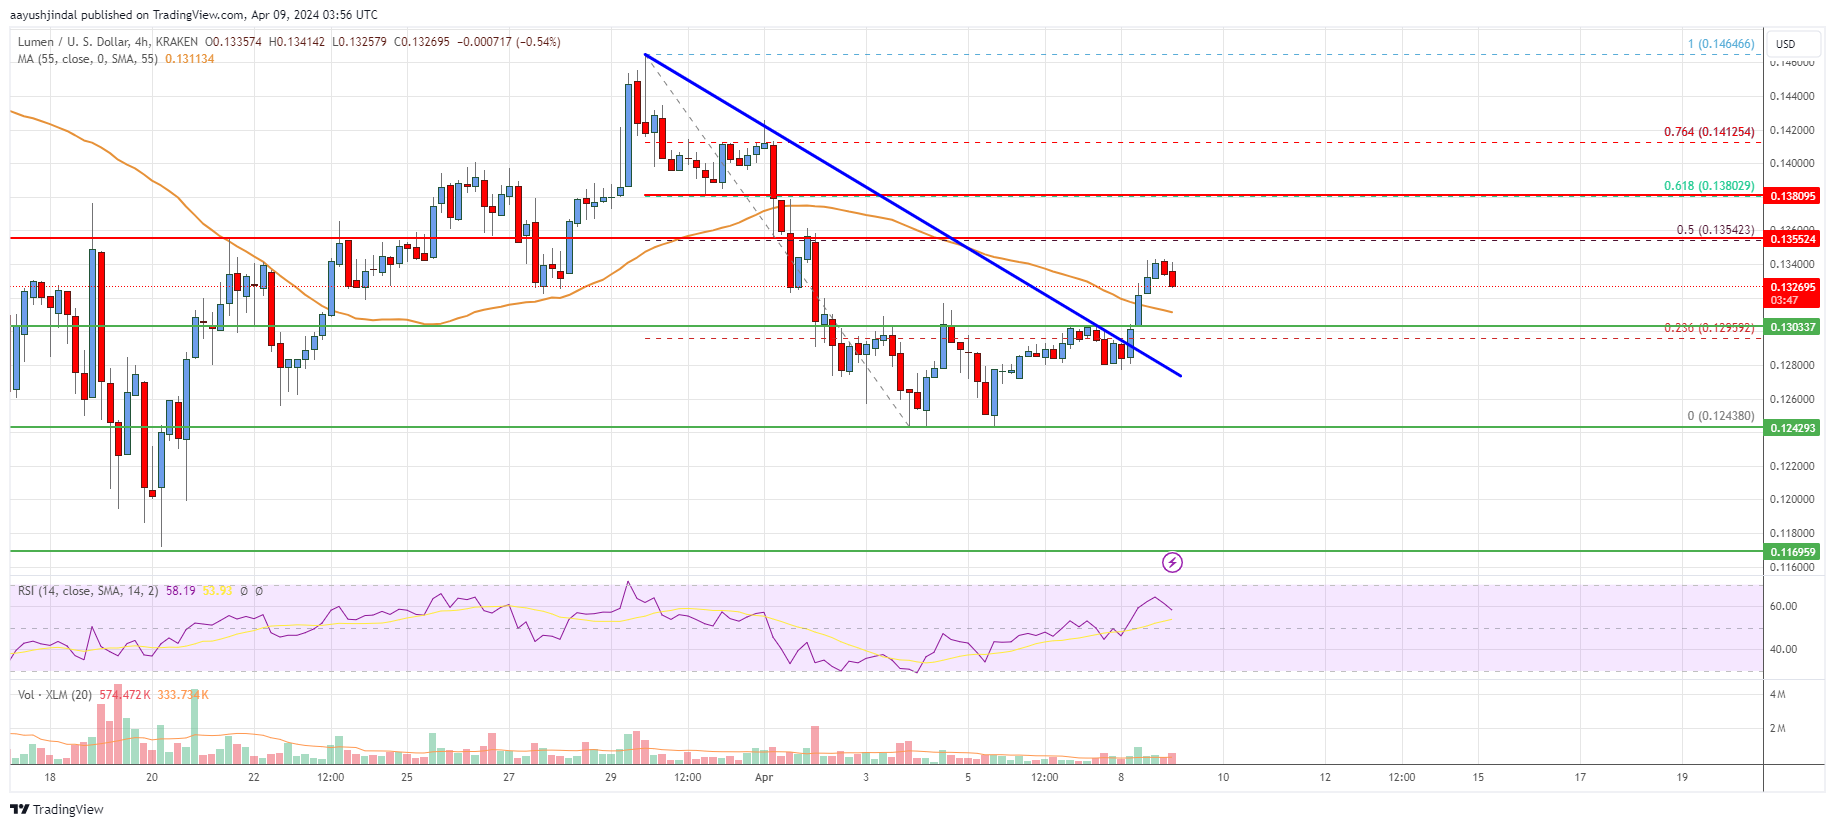
- There was a break above a key bearish trend line with resistance at $0.1285 on the 4-hour chart (data feed via Kraken).
- The pair could accelerate higher if there is a clear move above the $0.1380 resistance zone.
Stellar lumen price is trading in a positive zone above $0.1300 against the US Dollar, like Bitcoin. XLM price must clear $0.1380 to gain bullish momentum.
Stellar Lumen Price Analysis (XLM to USD)
After forming a base above the $0.1240 zone, Stellar lumen price started a decent increase against the US Dollar. The XLM/USD pair traded above the $0.1280 resistance to move into a positive zone.
There was a break above a key bearish trend line with resistance at $0.1285 on the 4-hour chart. The price cleared the 23.8% Fib retracement level of the downward move from the $0.1464 swing high to the $0.1243 low. XLM is now trading above $0.1300 and the 55 simple moving average (4 hours).
On the upside, the price is facing resistance near the $0.1350 zone. It is near the 50% Fib retracement level of the downward move from the $0.1464 swing high to the $0.1243 low. The next major resistance is near the $0.1380 level.
A clear move above the $0.1380 level might send the price toward the $0.150 zone. Any more gains could lead the price toward the $0.1650 level or even $0.1680.
Initial support on the downside is near the $0.130 level. The main support is near the $0.1240 zone. Any more losses could lead the price toward the $0.1200 level in the near term, below which the price might even retest $0.1150.
The chart indicates that XLM price is now trading above $0.130 and the 55 simple moving average (4 hours). Overall, the price could start a major increase if there is a clear move above the $0.1380 resistance zone.
Technical Indicators
4 hours MACD – The MACD for XLM/USD is gaining momentum in the bullish zone.
4 hours RSI – The RSI for XLM/USD is now above the 50 level.
Key Support Levels – $0.1300 and $0.1240.
Key Resistance Levels – $0.1350, $0.1380, and $0.1500.