- Stellar lumen price is attempting a fresh increase from the $0.1100 zone against the US Dollar.
- XLM price is now trading above $0.1125 and the 55 simple moving average (4 hours).
- There is a key bullish trend line forming with support near $0.1140 on the 4-hour chart (data feed via Kraken).
- The pair could start a decent increase if there is a clear move above the $0.1165 resistance zone.
Stellar lumen price is trading above $0.1150 against the US Dollar, like Bitcoin. XLM price must clear $0.1165 to gain bullish momentum.
Stellar Lumen Price Analysis (XLM to USD)
After a steady increase, Stellar lumen price saw a rejection pattern near the $0.1200 zone against the US Dollar. The XLM/USD pair traded below the $0.1165 support and tested the $0.1100 zone.
A low is formed near $0.1101 and the price is now attempting a recovery wave. There was a break above the $0.1132 resistance zone. The price climbed above the 50% Fib retracement level of the downward move from the $0.1204 swing high to the $0.1101 low.
XLM is now trading above $0.1150 and the 55 simple moving average (4 hours). There is also a key bullish trend line forming with support near $0.1140 on the 4-hour chart.
On the upside, the price is facing resistance near the $0.1165 zone or the 61.8% Fib retracement level of the downward move from the $0.1204 swing high to the $0.1101 low. The next major resistance is near the $0.1200 level.
A clear move above the $0.1200 level might send the price toward the $0.1250 level. Any more gains could lead the price toward the $0.1300 level or even $0.1320.
Initial support on the downside is near the $0.1140 level. The main support is near the $0.1125 zone. Any more losses could lead the price toward the $0.1100 level in the near term, below which the price might even retest $0.1050.
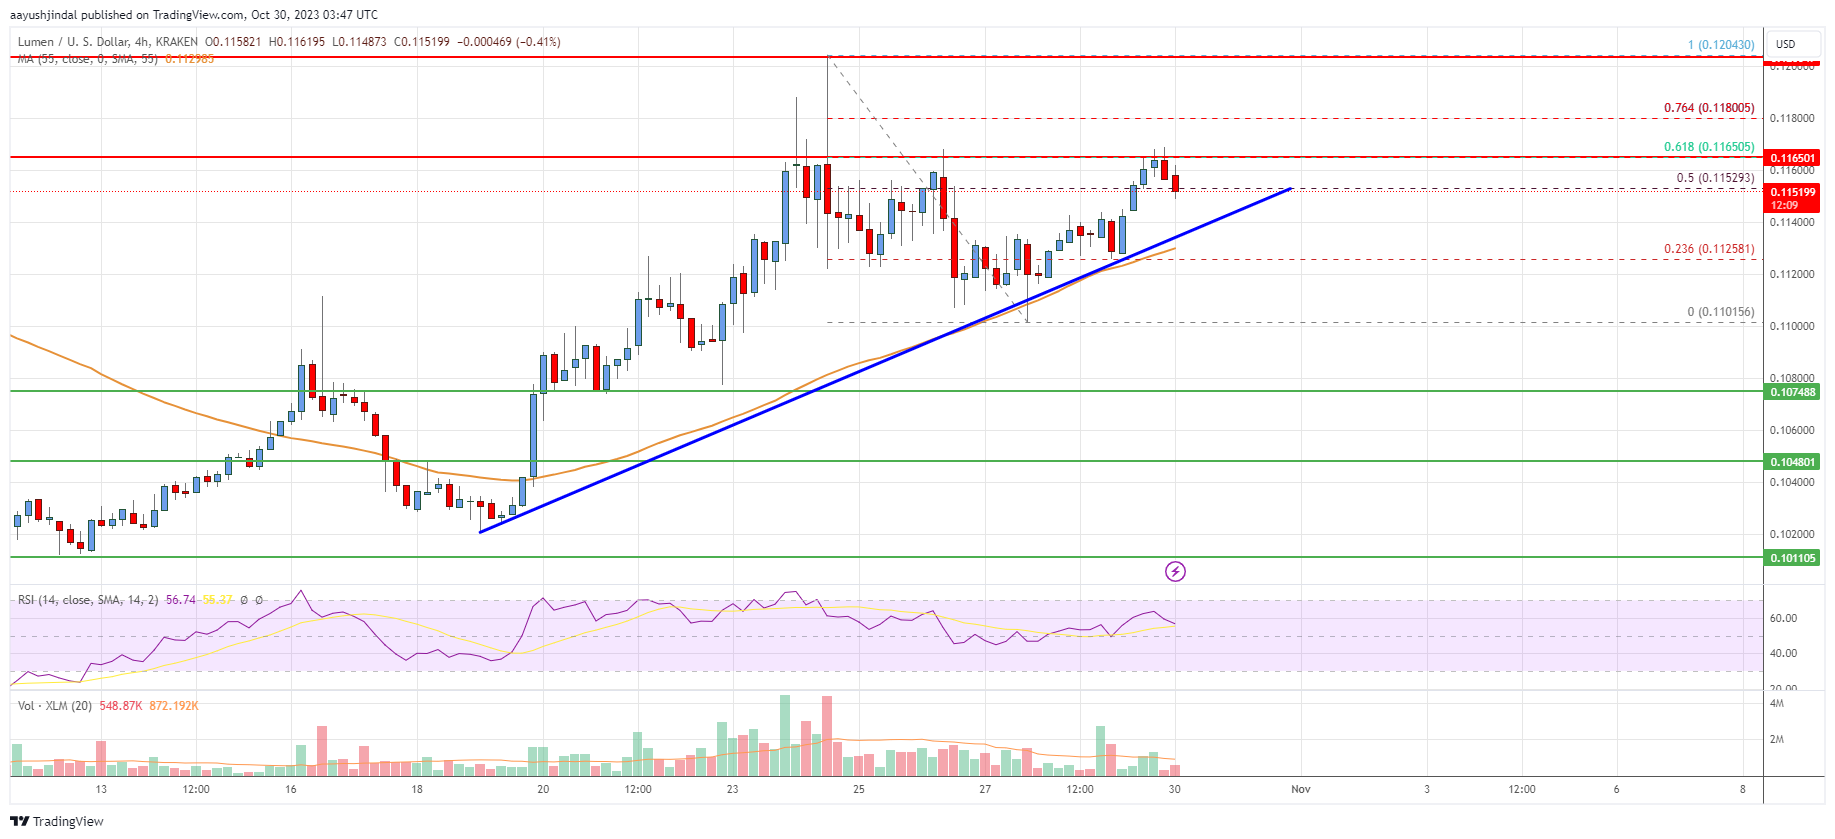
The chart indicates that XLM price is now trading above $0.1150 and the 55 simple moving average (4 hours). Overall, the price could start a major increase if there is a clear move above the $0.1165 resistance zone.
Technical Indicators
4 hours MACD – The MACD for XLM/USD is gaining momentum in the bullish zone.
4 hours RSI – The RSI for XLM/USD is now above the 50 level.
Key Support Levels – $0.1140 and $0.1132.
Key Resistance Levels – $0.1165, $0.1200, and $0.1250.