

Bitcoin has been witnessing a massive bullish wave that drove its price from around $1,000 in the beginning of the year to around $4,500 towards the end of the third quarter of the year. Now, as bitcoin has gained more than 350% in market capital, will it continue on rising throughout the last quarter of the year? or will it crash by the end of 2017?
Why has bitcoin price been rising?
It is almost impossible to find a clear answer(s) for this question, but a lot of global political events, bitcoin network modifications and economic conditions could be attributed to the flourish of bitcoin. 2017 has witnessed some major political events including the Brexit and Trump’s inauguration as the 45th President of the United States, which contributed, in a way or another, to increased public’s confidence in bitcoin’s decentralized economy model.
According to the Global Risks Perception Survey (GRPS), election of Trump, the Brexit and the rise of populism represent the biggest geopolitical risks facing global economic growth and reform in 2017. Whenever the public’s concerns regarding the future of the fiat economy rise, the price of bitcoin, and major altcoins, rise accordingly and this was the case in 2017.
The SegWit implementation was a major event that took place in 2017, signaling the birth of a better bitcoin. SegWit improves the currency’s scalability as it acts to boost the block size from 1 MB to approximately 1.8 MB without having to modify the bitcoin protocol. Implementation of SegWit was followed by a bullish rally that boosted Bitcoin price from around $2,800 to $4,300 during the month of August.
A Close Look at the BTCUSD 1 Day Chart:
Let’s examine the 1 day BTCUSD chart from Bitfinex, while plotting the MACD indicator, Williams Alligator and Bollinger Bands (look at the below chart). We can plot a Gann Angle Placement now between the low recorded on 15th December, 2016 and the high recorded on the 16th of August, 2017, to predict bitcoin price in the future. As noted on the chart, bitcoin price has just crossed above the 1 x 1 Gann angle, so we expect it to drop a bit below the level of this angle, before it continues rising again. A price correction wave could take bitcoin price to around $4,200 within the upcoming few weeks, before heading up to the $5,000 price mark towards the end of the year.
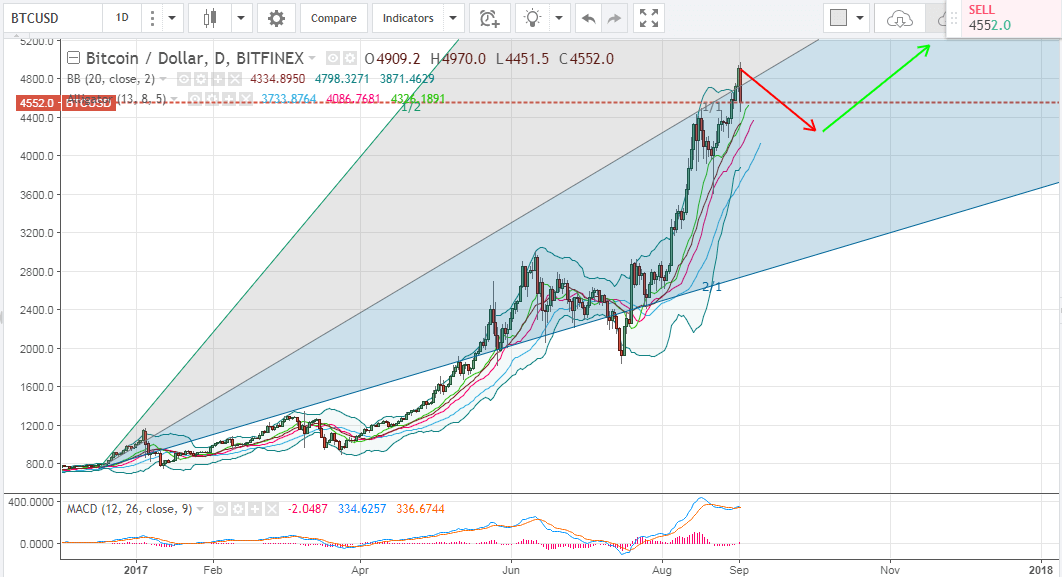

Candlesticks are currently tangential to the upper Bollinger band, which reflects that bitcoin is more or less overbought, so it will most probably drop down towards the middle Bollinger band where the market would be more stable. However, this downwards correction wave would be short as the Williams Alligator’s SMAs are exhibiting a bullish alignment, which reflects that the market’s bulls still have the upper hand.
Conclusion:
Bitcoin price has increased by more than 350% since the beginning of 2017. Even though analysis of the charts denotes that we are ahead of a downwards price correction wave, it also shows that it will continue rising shortly within a few weeks, as we approach the end of the year.
Chart from Bitfinex, hosted on Tradingview.com


