- XRP price is attempting a fresh increase from the $0.525 support against the US dollar.
- The price is now trading below $0.555 and the 55 simple moving average (4 hours).
- There is a key bearish trend line forming with resistance near $0.5610 on the 4-hour chart of the XRP/USD pair (data source from Kraken).
- The pair could start a fresh increase above the $0.5550 resistance.
XRP price is consolidating near $0.5450 against the US Dollar, like Bitcoin. It must stay above the $0.5250 support to start a fresh increase.
XRP Price Analysis
This past week, XRP price made another attempt to clear the $0.5750 resistance against the US Dollar. The XRP/USD pair struggled to clear $0.5750 and started a downside correction.
There was a move below the $0.5550 and $0.540 support levels. However, the bulls were active above the $0.525 support. A low has formed near $0.5250 and the price is now attempting a fresh increase. XRP is now trading below $0.5550 and the 55 simple moving average (4 hours).
There was a move above the 23.6% Fib retracement level of the downward move from the $0.5752 swing high to the $0.5250 low. On the upside, the price is facing resistance near $0.550.
The next major resistance is near the $0.560 level. There is also a key bearish trend line forming with resistance near $0.5610 on the 4-hour chart of the XRP/USD pair. The trend line is near the 61.8% Fib retracement level of the downward move from the $0.5752 swing high to the $0.5250 low.
The first major resistance is near the $0.575 zone. A clear move above the $0.5750 resistance zone might start a strong increase. In the stated case, the price could even surpass the $0.5850 zone and test $0.600. Any more gains might send the price toward the $0.6250 resistance.
Initial support on the downside is near the $0.5300 level. The next major support is near the $0.5250 level. Any more losses could lead the price toward the $0.5160 level, below which the price might even test the $0.500 support zone in the near term.
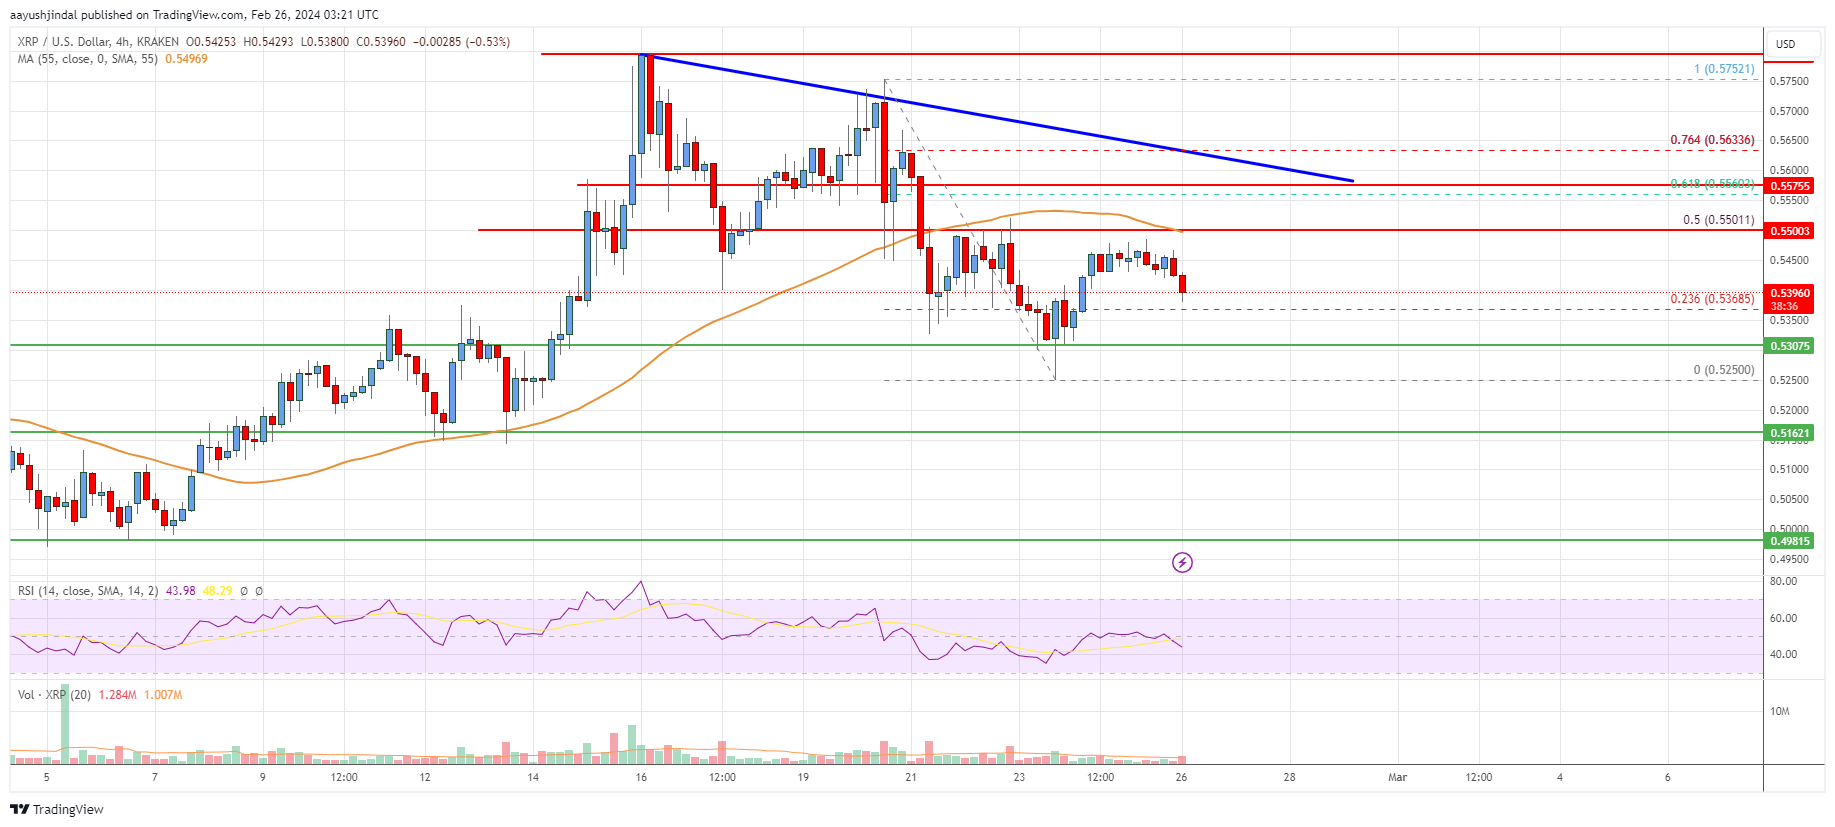
Looking at the chart, XRP price is now trading below the $0.550 zone and the 55 simple moving average (4 hours). Overall, the price could start a fresh increase above the $0.5550 resistance.
Technical indicators
4 hours MACD – The MACD for XRP/USD is now losing momentum in the bullish zone.
4 hours RSI (Relative Strength Index) – The RSI for XRP/USD is below the 50 level.
Key Support Levels – $0.5300, $0.5250, and $0.500.
Key Resistance Levels – $0.550 and $0.560.