- XRP price started a fresh decline from the $0.5400 resistance against the US dollar.
- The price is now trading below $0.5350 and the 55 simple moving average (4 hours).
- There is a connecting bearish trend forming with resistance near $0.5180 on the 4-hour chart of the XRP/USD pair (data source from Bittrex).
- The pair could extend losses if it breaks the $0.500 support zone.
XRP price is struggling below $0.5350 against the US Dollar, unlike Bitcoin. The price could decline further if it settles below the $0.500 support in the near term.
XRP Price Analysis
In the past few sessions, Ripple’s XRP price started a fresh decline from the $0.5400 zone against the US Dollar. The XRP/USD pair stayed below the $0.5320 level and extended its decline.
The bears were able to push the price below the $0.5220 support. The bears were able to push the price below the 50% Fib retracement level of the recovery wave from the $0.4850 swing low to the $0.5270 high. The price is now consolidating near the $0.500 support.
The bulls are protecting the 61.8% Fib retracement level of the recovery wave from the $0.4850 swing low to the $0.5270 high. XRP is now trading below $0.532 and the 55 simple moving average (4 hours).
Immediate resistance on the upside is near the $0.5165 level. There is also a connecting bearish trend forming with resistance near $0.5180 on the 4-hour chart of the XRP/USD pair. The next major resistance is near the $0.5250 level.
A clear move above $0.5250 might start a fresh increase. In the stated case, the price could even surpass the $0.5400 resistance. Any more gains might send the price toward the $0.5650 resistance.
Initial support on the downside is near $0.500. The next major support is near the $0.4850 level. Any more losses could lead the price toward the $0.450 level, below which the price might even test $0.425.
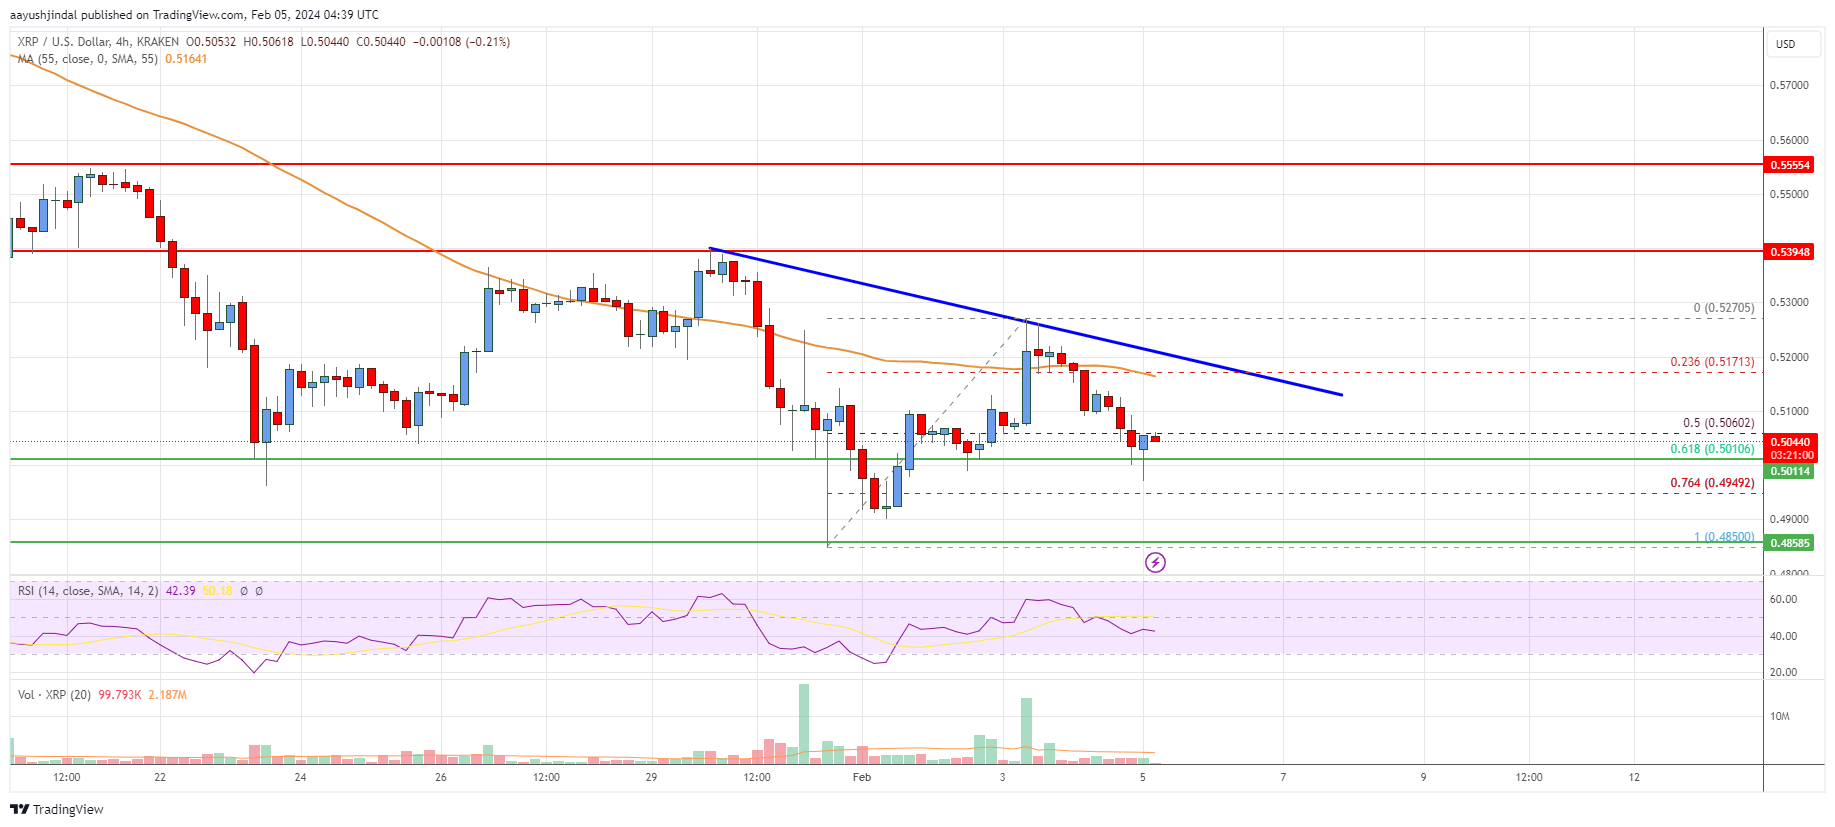
Looking at the chart, the price is now trading below the $0.5320 zone and the 55 simple moving average (4 hours). Overall, the price could extend losses if it breaks the $0.500 support zone.
Technical indicators
4 hours MACD – The MACD for XRP/USD is now gaining momentum in the bearish zone.
4 hours RSI (Relative Strength Index) – The RSI for XRP/USD is below the 50 level.
Key Support Levels – $0.500, $0.485, and $0.450.
Key Resistance Levels – $0.518 and $0.525.