
- Bitcoin cash price rallied recently and climbed above the $280 resistance against the US Dollar.
- The price is currently consolidating above $180 and seems to be setting up for the next break.
- There is a major breakout pattern forming with resistance near $284 on the 4-hours chart of the BCH/USD pair (data feed from Kraken).
- The pair could either rally again above $285 or it might extend its correction to $260.
Bitcoin cash price is trading in a nice uptrend above $280 against the US Dollar. BCH/USD is likely to surge above $300 once it clears the $285 resistance area.
Bitcoin Cash Price Analysis
In the past few days, there was a strong rise in bitcoin cash price above the $265 and $280 resistance levels. Moreover, there was a close above the $280 barrier and the 55 simple moving average (4-hours).
It opened the doors for more gains and the price climbed sharply above the $295 resistance. Finally, the price traded to a new monthly high near $307 before starting a downside correction.
Bitcoin cash traded below the $295 and $290 support levels. Besides, there was a break below the 23.6% Fib retracement level of the recent wave from the $243 swing low to $307 high. The price even spiked below the $280 support area.
However, the $275 level acted as a strong support and prevented additional losses. It seems like the 50% Fib retracement level of the recent wave from the $243 swing low to $307 high is holding losses very well.
More importantly, there is a major breakout pattern forming with resistance near $284 on the 4-hours chart of the BCH/USD pair. If there is an upside break above the $284 and $285 levels, the price is likely to accelerate higher in the near term.
An immediate resistance is near the $295 level, above which bitcoin cash might surge above the $300 level. Conversely, if there is a downside break below the $280 and $275 supports, the price could slide towards the $260 support area. The 50 55 simple moving average (4-hours) is also near $260 to provide support.
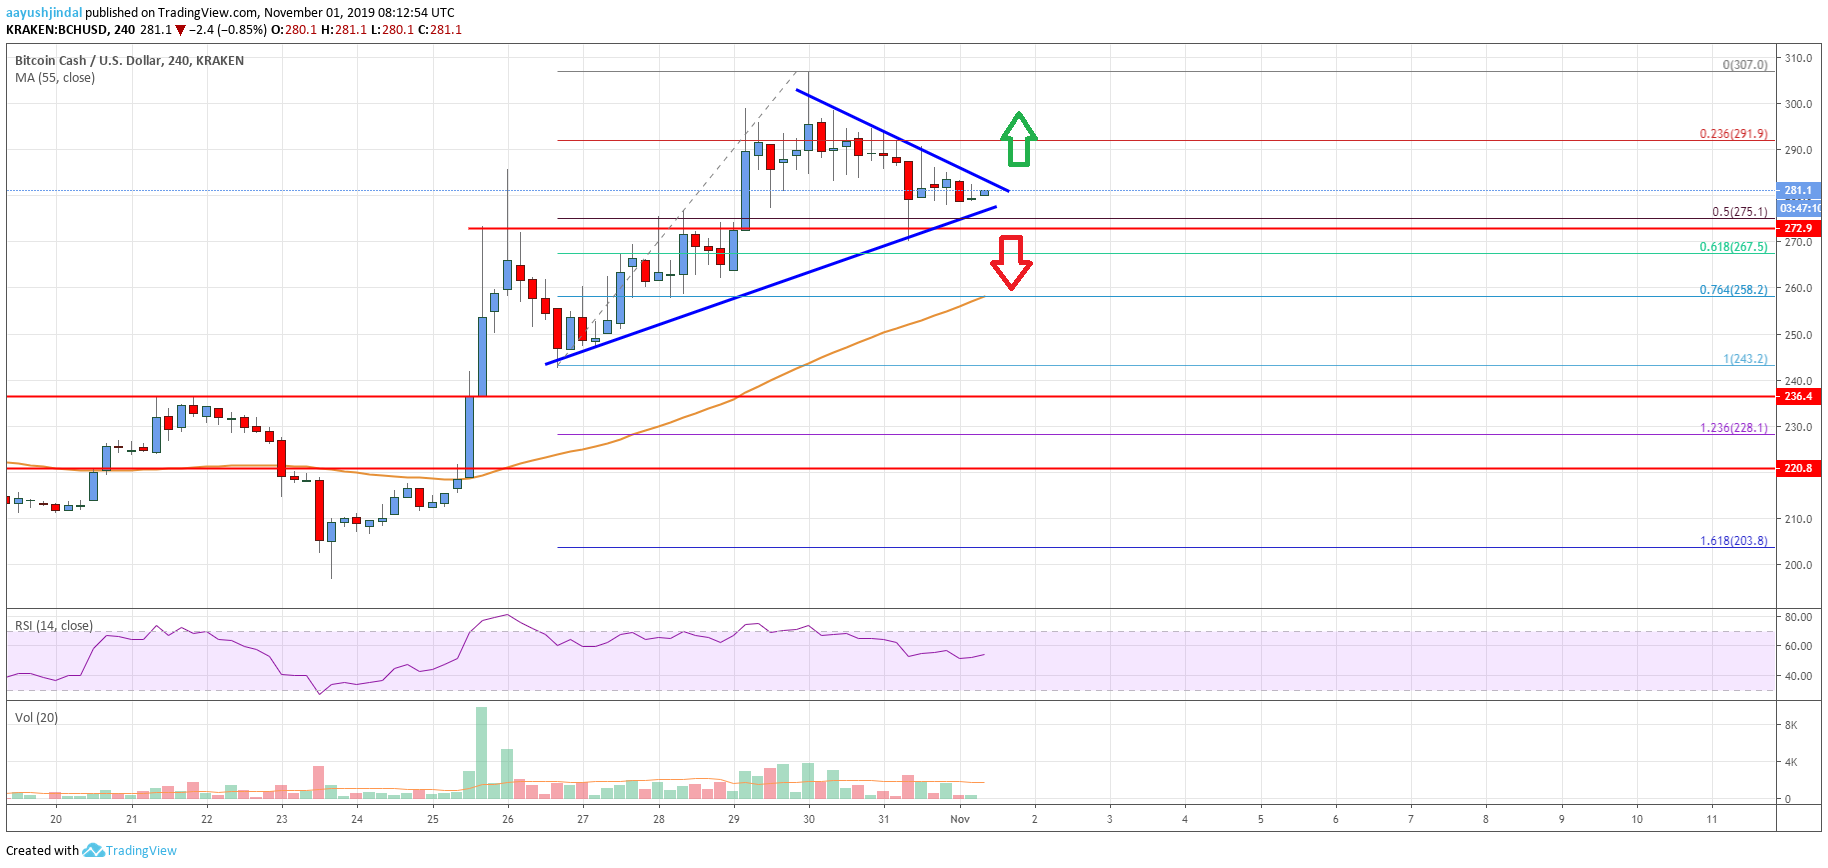
Looking at the chart, bitcoin cash price is clearly preparing for the next key break and it could either rally again above $285 or it might extend its correction to $260. A clear break above the $285 barrier is likely to set the price for another leg higher above $300.
Technical indicators
4 hours MACD – The MACD for BCH/USD is currently losing momentum in the bullish zone.
4 hours RSI (Relative Strength Index) – The RSI for BCH/USD is still well above the 50 level.
Key Support Levels – $280 and $260.
Key Resistance Levels – $285 and $300.


Leave a Reply
You must be logged in to post a comment.