- Bitcoin cash price is slowly moving lower towards the key $320 support area against the US Dollar.
- The price is facing a couple of important resistances near the $335 and $340 levels.
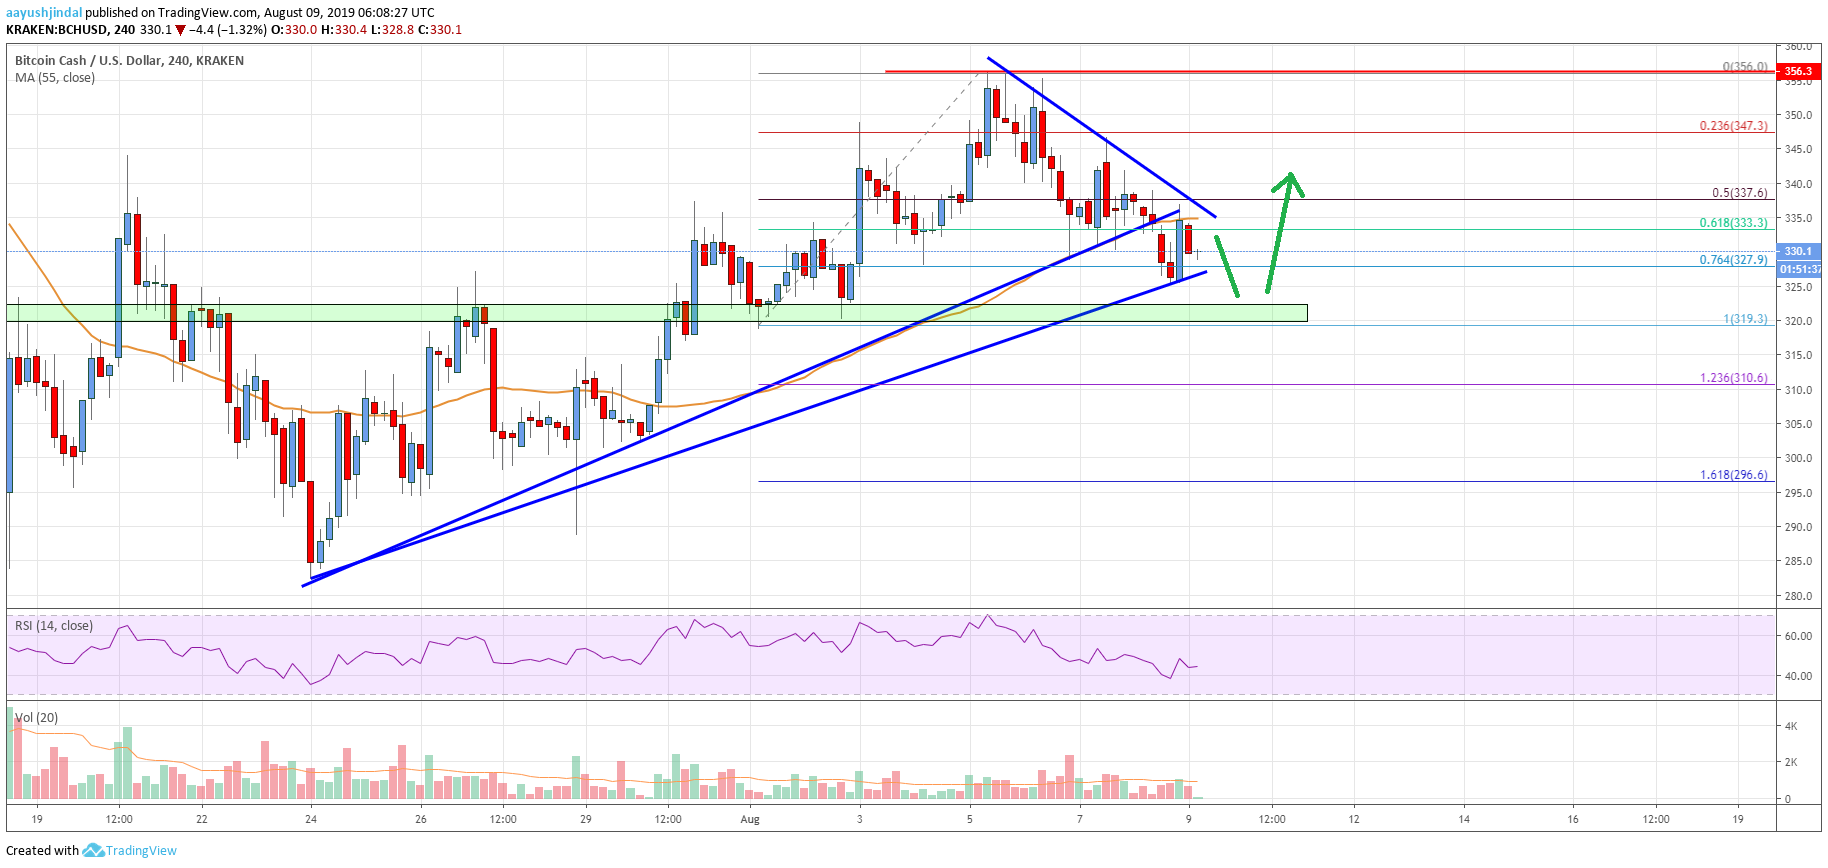
- There is a key bearish trend line forming with resistance near $335 on the 4-hours chart of the BCH/USD pair (data feed from Kraken).
- The pair could spike towards the $320 or $315 support before it could rise towards $350.
Bitcoin cash price is currently declining towards $320 against the US Dollar. BCH price is likely to bounce back unless there is a daily close below the $320 support.
Bitcoin Cash Price Analysis
Earlier this week, bitcoin cash price climbed above the $335 and $340 resistance levels against the US Dollar. The BCH/USD pair even settled above $335 and the 55 simple moving average (4-hours). Finally, the price surpassed the $350 resistance and traded to a new monthly high at $356. However, the price failed to stay above $350 and recently started a fresh decline.
It traded below the $340 support level to move back into a short term bearish zone. Moreover, there was a break below the 50% Fib retracement level of the last wave from the $319 low to $356 high. The price is now trading below the $335 level and the 55 simple moving average (4-hours). Additionally, it traded below a connecting bullish trend at $335 on the 4-hours chart.
At the moment, the price is trading near the $328 support and another trend line on the same chart. Moreover, the 76.4% Fib retracement level of the last wave from the $319 low to $356 high is near the $327 level. The main support is near the $320 level, below which the price could start a substantial decline in the coming sessions. The next support is at $310, followed by the $300 handle.
On the upside, there is a key bearish trend line forming with resistance near $335 on the same chart. If there is a successful break above the $335 and $340 resistance levels, the price could start a fresh increase. The next key resistance is at $355, followed by $362.
Looking at the chart, bitcoin cash price is currently correcting gains from the $356 high. It is trading above a couple of important supports near $320. Therefore, there are high chances of a fresh increase as long as the price is trading above the $320 support.
Technical indicators
4 hours MACD – The MACD for BCH/USD is losing momentum in the bearish zone.
4 hours RSI (Relative Strength Index) – The RSI for BCH/USD is currently below 50, with a flat structure.
Key Support Levels – $320 and $300.
Key Resistance Levels – $335 and $355.

