- Bitcoin cash price found support near the $365 level and recently recovered against the US Dollar.
- The price gained strength above the $390 and $400 resistance levels to move into a positive zone.
- There was a break above two bearish trend lines with resistance at $390 on the 4-hours chart of the BCH/USD pair (data feed from Kraken).
- The pair remains well supported on the downside near the $400 and $390 levels.
Bitcoin cash price rebounded nicely above $390 and $400 against the US Dollar. BCH is currently struggling near $425, but it is likely to gain pace in the coming sessions towards $450.
Bitcoin Cash Price Analysis
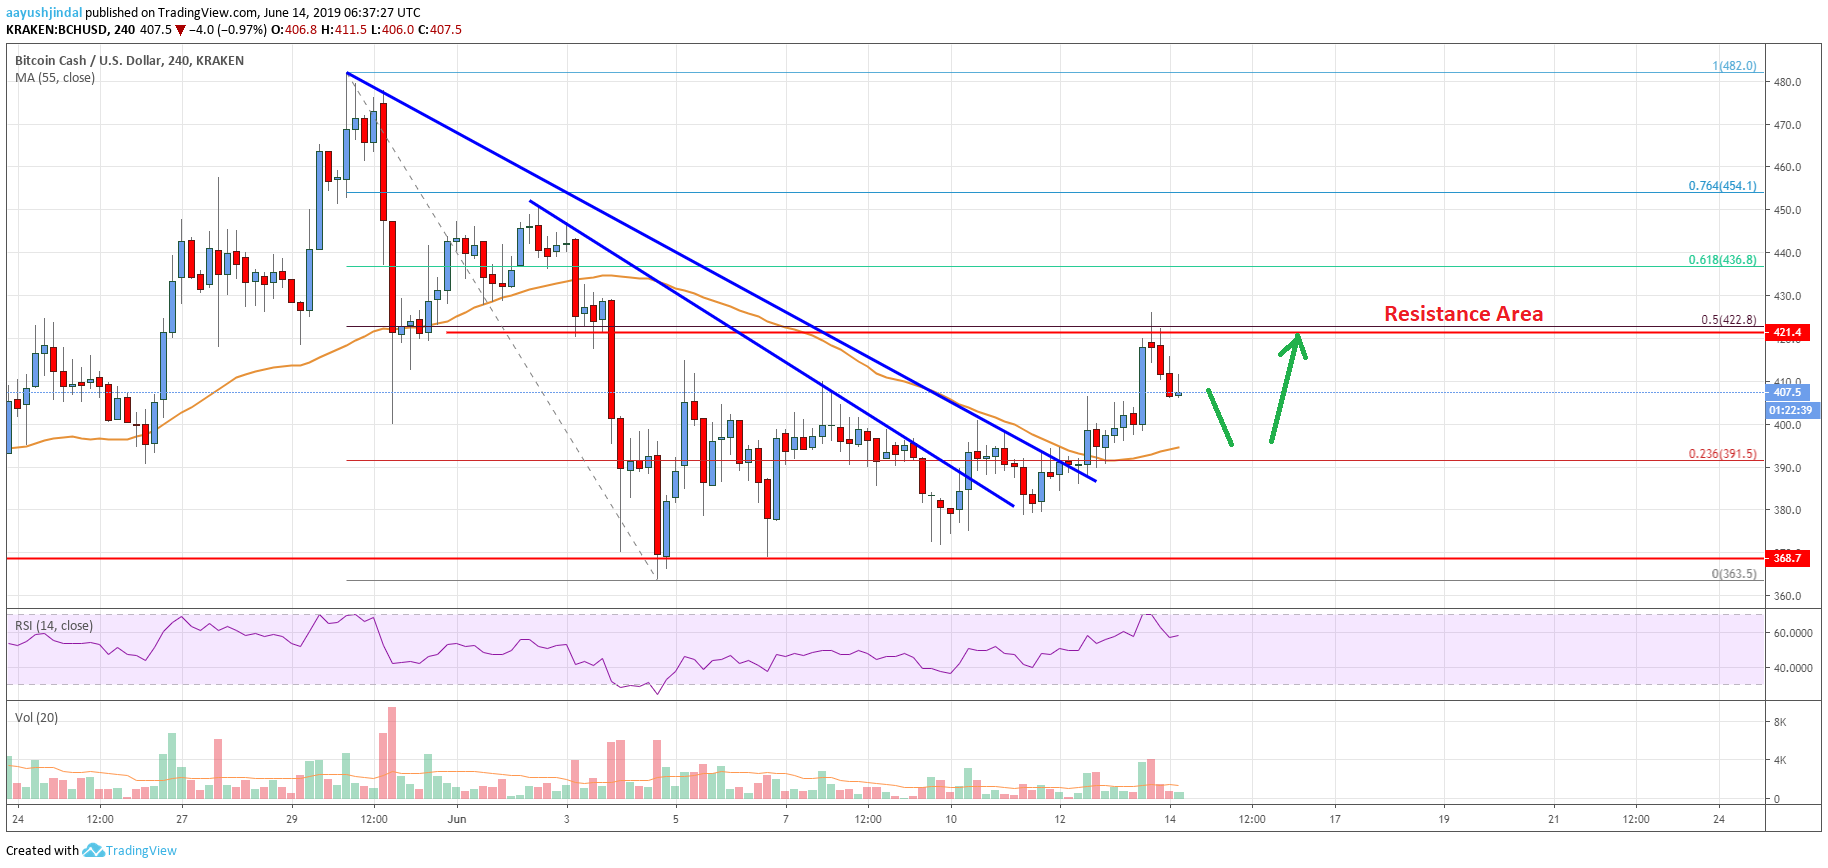
After a couple of swing moves, bitcoin cash price found support near the $365 and $370 levels against the US Dollar. The BCH/USD pair formed a swing low at $363.5 and recently started a steady rise. The last low was near $368.7 before the price climbed above the $375 and $380 resistance levels.
During the rise, the price broke the 23.6% Fib retracement level of the last decline from the $482 high to $363 swing low. Moreover, there was a break above two bearish trend lines with resistance at $390 on the 4-hours chart of the BCH/USD pair. The pair is now trading well above the $400 level and the 55 simple moving average (4-hours).
However, the upward move was capped by the $422 level. Moreover, the 50% Fib retracement level of the last decline from the $482 high to $363 swing low seems to be acting as a resistance. At the moment, the price is correcting lower and trading near the $410 level. The main support is near the $400 level and the 55 simple moving average (4-hours).
If there is a downside break below $400, the price could accelerate decline towards the $380 level. On the upside, a break above the $425 level is needed for more upsides in the near term. The next key resistance is near $450, above which the price is likely to accelerate towards the $475 level.

Looking at the chart, bitcoin cash price is clearly trading in a positive zone above $400 and 55 simple moving average (4-hours). As long as the price is above $400, it is likely to break the $425 and $430 resistance levels. On the downside, below $400, the price may perhaps struggle to clear the $380 support.
Technical indicators
4 hours MACD – The MACD for BCH/USD is slowly reducing its bullish slope.
4 hours RSI (Relative Strength Index) – The RSI for BCH/USD is currently correcting lower towards the 55 level.
Key Support Levels – $400 and $380.
Key Resistance Levels – $425 and $450.


Leave a Reply
You must be logged in to post a comment.