- Bitcoin cash price started a fresh decline from $585 against the US Dollar.
- The price is now trading below the $500 zone and the 55 simple moving average (4-hours).
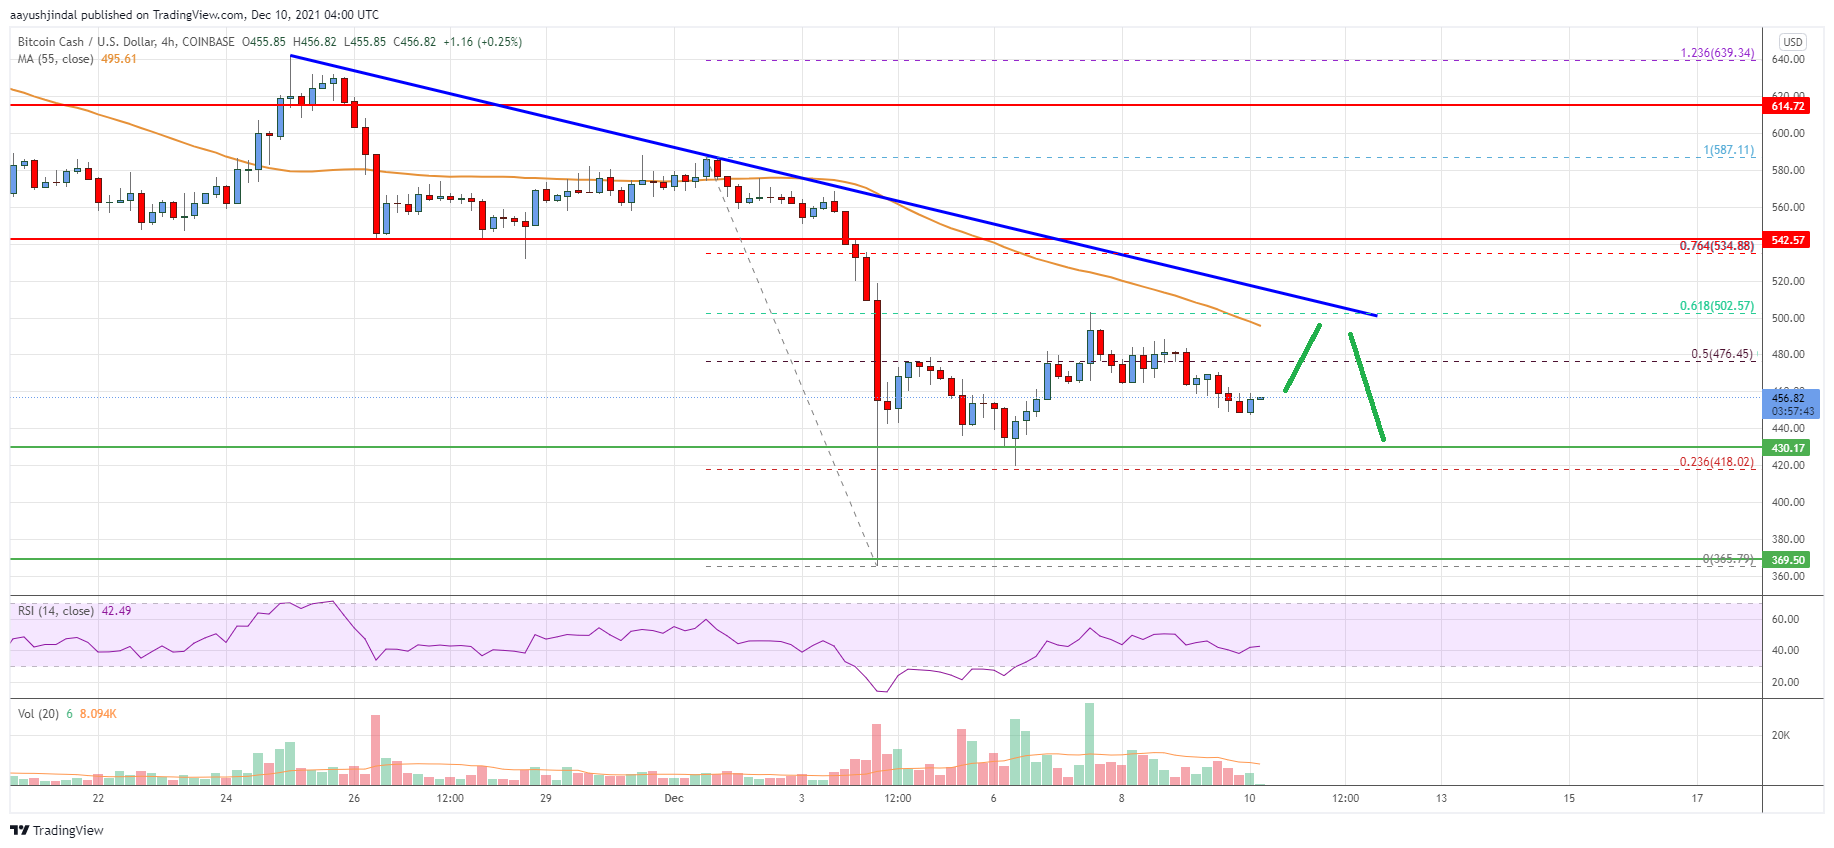
- There is a major bearish trend line forming with resistance near $500 the 4-hours chart of the BCH/USD pair (data feed from Coinbase).
- The pair must gain pace above $500 for a fresh increase in the near term.
Bitcoin cash price is showing bearish signs below $500 against the US Dollar, similar to bitcoin. BCH/USD could resume its decline unless it surges above $500.
Bitcoin Cash Price Analysis
Bitcoin cash price started a major decline below the $550 support zone. BCH even broke the $500 support level and settled below the 55 simple moving average (4-hours).
There was also a spike below the $400 level. A low was formed near $365 and the price is now correcting higher. There was a break above the 50% Fib retracement level of the downward move from the $587 swing high to $365 low.
An immediate hurdle on the upside is near the $495 level and the 55 simple moving average (4-hours). There is also a major bearish trend line forming with resistance near $500 the 4-hours chart of the BCH/USD pair.
The trend line is near the 61.8% Fib retracement level of the downward move from the $587 swing high to $365 low. A clear break above $490 and $500 might spark a fresh rally. In the stated case, the price could rise towards the $550 level.
An initial support is near the $440 level. The first major support is near the $430 level. A downside break below the $440 and $430 support levels might start a major decline.
The next major support is near the $400 level, below which the bears might aim a test of $365. Any more downsides might lead the price towards the $320 level.

Looking at the chart, bitcoin cash price is now trading below the $500 zone and the 55 simple moving average (4-hours). Overall, the price must gain pace above $500 for a fresh increase in the near term.
Technical indicators
4 hours MACD – The MACD for BCH/USD is slowly gaining pace in the bearish zone.
4 hours RSI (Relative Strength Index) – The RSI for BCH/USD is now below the 50 level.
Key Support Levels – $440 and $430.
Key Resistance Levels – $490 and $500.


Leave a Reply
You must be logged in to post a comment.