
- Bitcoin cash price started a fresh decline from the $135 zone against the US Dollar.
- The price is now trading below the $130 zone and the 55 simple moving average (4 hours).
- There was a break below a key bullish trend line with support near $131 on the 4-hour chart of the BCH/USD pair (data feed from Coinbase).
- The pair could start a decent increase if it stays above the $120 support zone.
Bitcoin cash price is declining from the $135 zone against the US Dollar, similar to Bitcoin. BCH/USD could decline heavily if there is a move below $120.
Bitcoin Cash Price Analysis
Bitcoin cash price struggled to gain pace for a move above the $135 and $136 resistance levels. BCH formed a high near $136.18 and started a fresh decline.
There was a clear move below the $130.00 and $125.00 support levels. Besides, there was a break below a key bullish trend line with support near $131 on the 4-hours chart of the BCH/USD pair. The pair even declined below the $125 support.
A low is formed near $121.37 and the price is now consolidating losses. It is now trading below the $128 zone and the 55 simple moving average (4 hours). Immediate resistance is near the $125 level. It is near the 23.6% Fib retracement level of the recent decline from the $136.18 swing high to the $121.37 low.
The next key resistance is near $128. It is near the 50% Fib retracement level of the recent decline from the $136.18 swing high to the $121.37 low.
The main resistance sits near the $130 level. Any more gains above $128 and $130 could set the pace for a move toward the $135 level. If there is a move above the $135 resistance, the price could rise toward the $142 zone.
If not, the price might continue lower below $121. Immediate support on the downside is near the $120 zone. The next major support is near the $115 level, below which the bears might aim for $105.
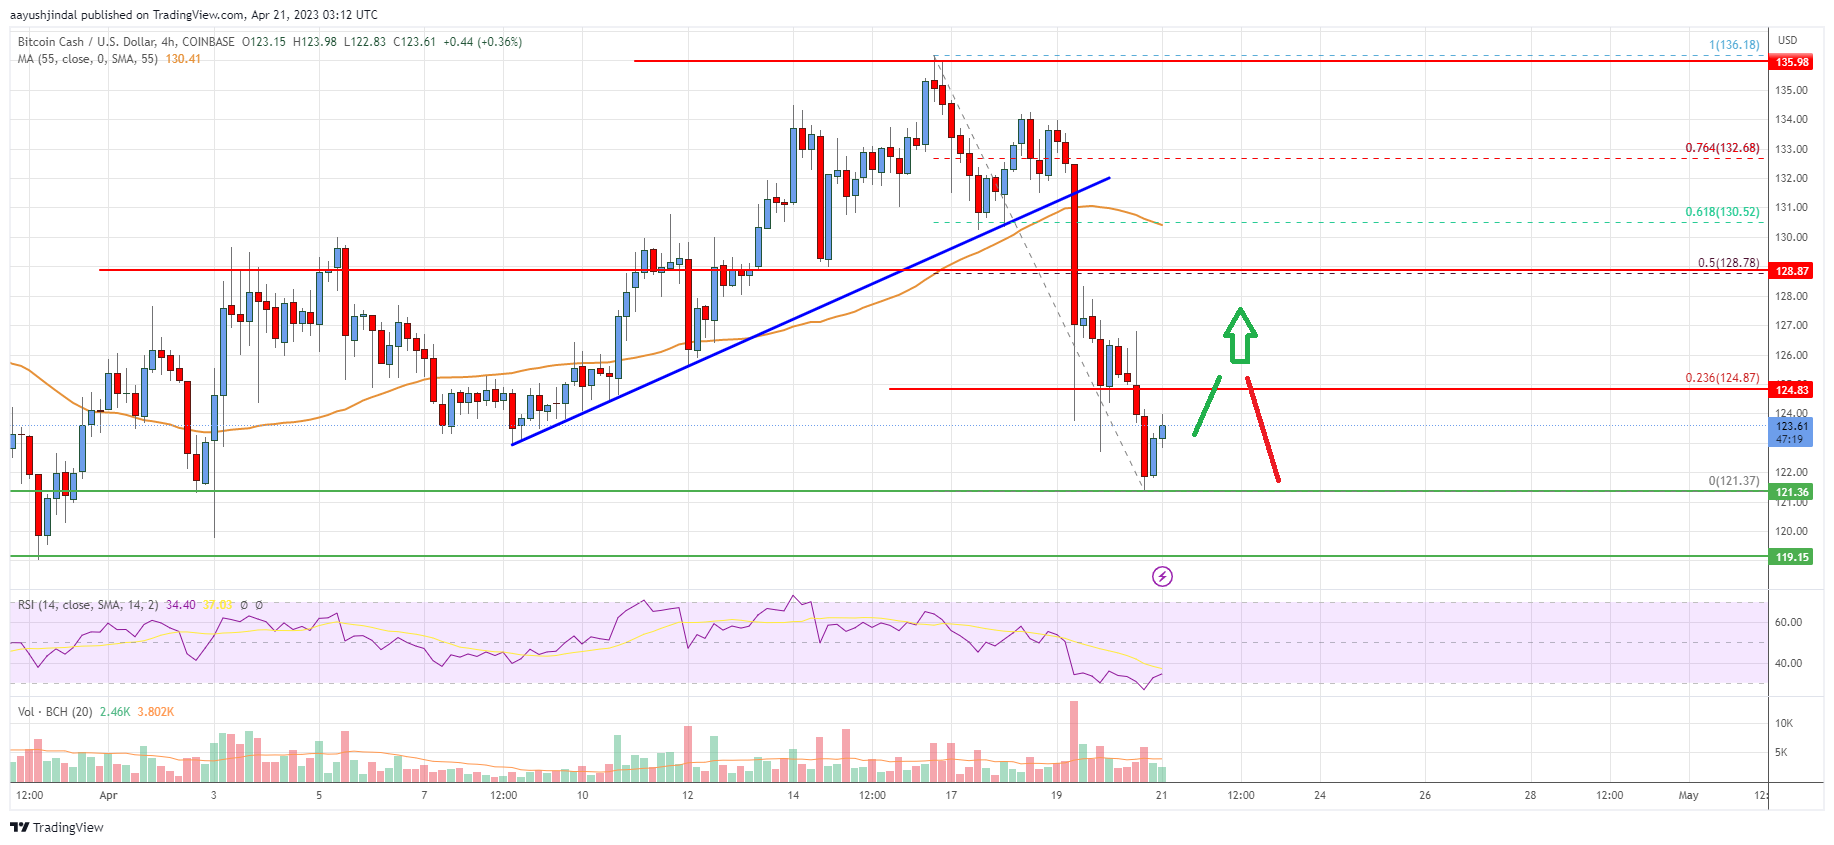
Looking at the chart, Bitcoin cash price is now trading below the $128 zone and the 55 simple moving average (4 hours). Overall, the price could start a decent increase if it stays above the $120 support zone.
Technical indicators
4 hours MACD – The MACD for BCH/USD is losing pace in the bearish zone.
4 hours RSI (Relative Strength Index) – The RSI for BCH/USD is below the 50 level.
Key Support Levels – $120 and $115.
Key Resistance Levels – $125 and $128.


Leave a Reply
You must be logged in to post a comment.