
- Bitcoin cash price declined sharply below $220 and traded close to $205 against the US Dollar.
- The price is currently correcting higher, but it is likely to face hurdles near $225.
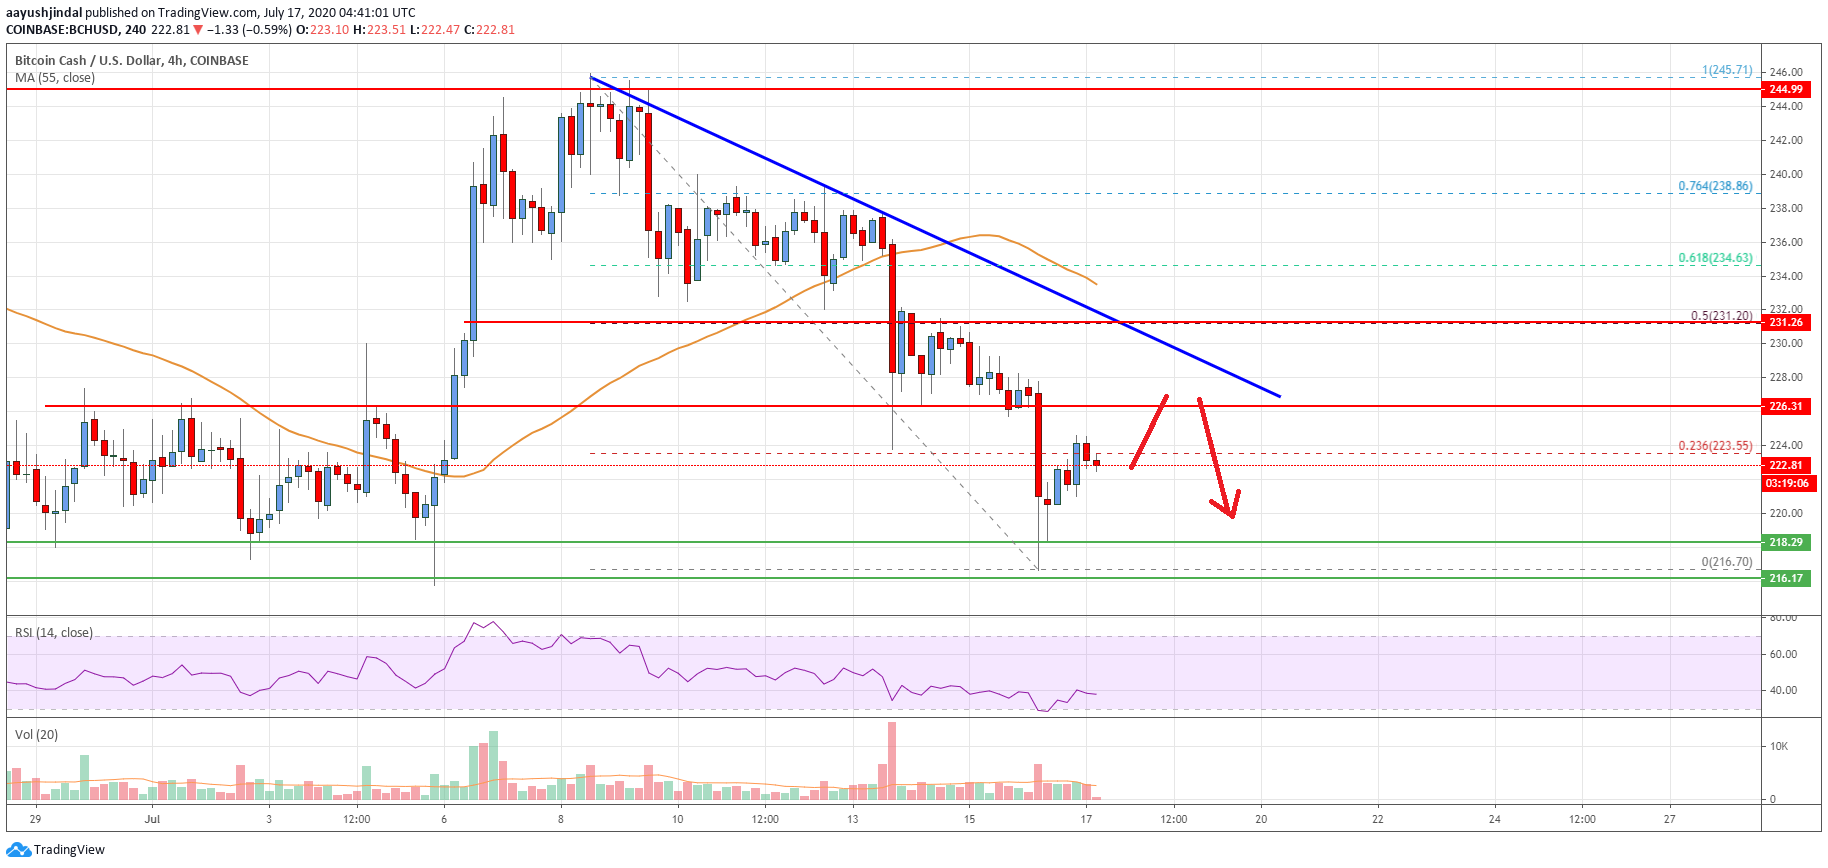
- There is a key bearish trend line forming with resistance near $224 on the 4-hours chart of the BCH/USD pair (data feed from Coinbase).
- The pair must surpass the $224 and $225 resistance levels to start a fresh increase in the near term.
Bitcoin cash price is facing a major hurdle near $225 $225 against the US Dollar. BCH/USD is likely to resume its decline unless it breaks the $225 resistance.
Bitcoin Cash Price Analysis
This past week, bitcoin cash price extended its decline below the main $225 support against the US Dollar. BCH price even broke the $215 support and the 55 simple moving average (4-hours).
The decline was such that the price traded close to the $200 handle. A low was formed near $205 and recently the price started a decent recovery wave. There was a break above the $210 and $215 levels.
The bulls were able to push the price above the 23.6% Fib retracement level of the last key drop from the $245 high to $205 low. However, the price is currently facing a strong resistance near the $224 and $225 levels (the recent breakdown zone).
It seems like the 50% Fib retracement level of the last key drop from the $245 high to $205 low is also acting as a hurdle. More importantly, there is a key bearish trend line forming with resistance near $224 on the 4-hours chart of the BCH/USD pair.
The pair is clearly facing an uphill task near the $225 level and the 55 simple moving average (4-hours). A clear break above the $225 resistance could open the doors for a larger upward move. The next major resistance is near the $235 level, followed by $240.
Conversely, the price is likely to continue lower below the $215 support level. The next major support is near the $205 and $200 levels, where the bulls are likely to take a stand.
Looking at the chart, bitcoin cash price must surpass the $224 and $225 resistance levels to start a fresh increase in the near term. If not, there could be a sharp decline towards the $200 handle.
Technical indicators
4 hours MACD – The MACD for BCH/USD is currently losing momentum in the bullish zone.
4 hours RSI (Relative Strength Index) – The RSI for BCH/USD is now close to the 40 level.
Key Support Levels – $215 and $205.
Key Resistance Levels – $225 and $235.


Leave a Reply
You must be logged in to post a comment.