- Bitcoin cash price started a decent increase above the $500 resistance against the US Dollar.
- The price is now trading above the $500 zone and the 55 simple moving average (4-hours).
- There is a major bullish trend line forming with support near $505 on the 4-hours chart of the BCH/USD pair (data feed from Coinbase).
- The pair is likely to accelerate higher above the $550 and $555 resistance levels.
Bitcoin cash price is gaining pace above the $500 zone against the US Dollar, similar to bitcoin. BCH/USD must clear $550 for more gains in the near term.
Bitcoin Cash Price Analysis
After formed a base above the $400 level, bitcoin cash price started a fresh increase. BCH broke many hurdles near the $450 level to move into a positive zone.
The price even broke the $500 barrier and the 55 simple moving average (4-hours). Finally, it surpassed the $520 level and it is now consolidating near the $550 resistance. The recent high was formed near $547 and the price is now stuck in a range.
An initial support is near the $528 level. It is near the 23.6% Fib retracement level of the upward move from the $467 swing low to $547 high.
The first major support is near the $518 level. There is also a major bullish trend line forming with support near $505 on the 4-hours chart of the BCH/USD pair. The trend line is close to the 50% Fib retracement level of the upward move from the $467 swing low to $547 high.
A downside break below the $505 support zone could open the doors for a larger decline. The next major support is near the $450 level. An initial resistance is near the $545 level. The first major resistance is near the $550 level. To continue higher, the price must clear the $550 resistance zone. The next major resistance is near the $585 level.
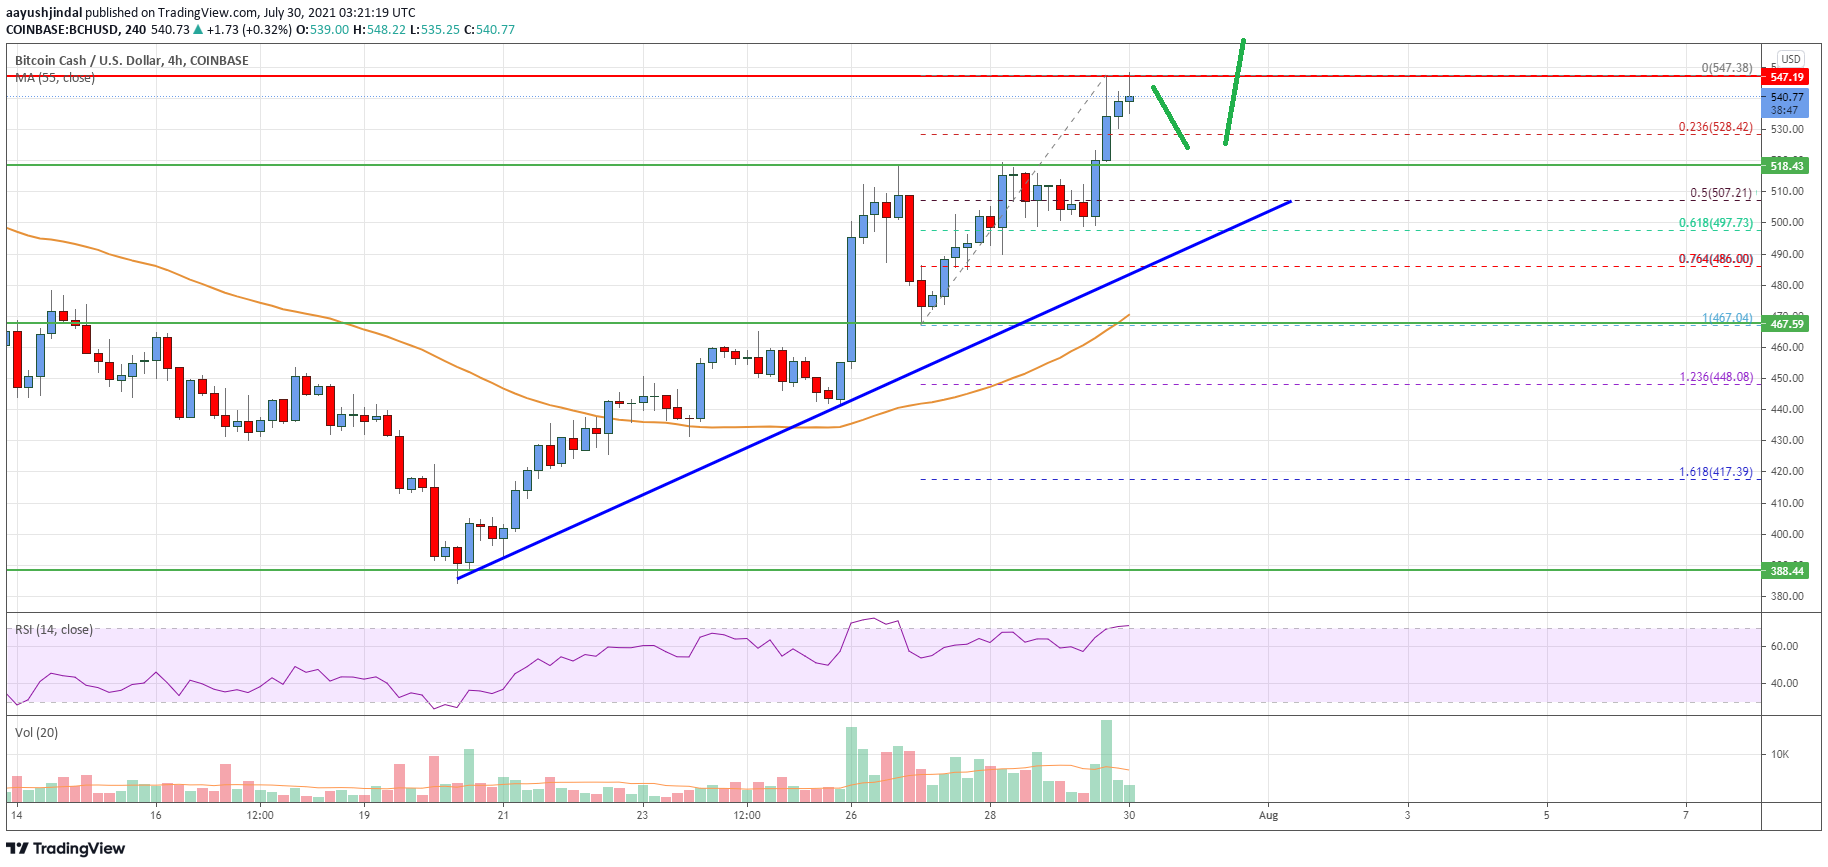
Looking at the chart, bitcoin cash price is now trading above the $500 zone and the 55 simple moving average (4-hours). Overall, the price is likely to accelerate higher above the $550 and $555 resistance levels.
Technical indicators
4 hours MACD – The MACD for BCH/USD is now gaining pace in the bullish zone.
4 hours RSI (Relative Strength Index) – The RSI for BCH/USD is above the 50 level.
Key Support Levels – $505 and $485.
Key Resistance Levels – $550 and $585.
