- Bitcoin cash is attempting a recovery wave from the $230 zone against the US Dollar.
- The price is now trading below the $245 zone and the 55 simple moving average (4 hours).
- There is a key rising channel forming with resistance near $255 on the 4-hour chart of the BCH/USD pair (data feed from Coinbase).
- The pair must clear $250 and $250 to start a steady upward movement in the near term.
Bitcoin cash price is rising from $230 against the US Dollar, like Bitcoin. BCH/USD could start a fresh surge if it clears the $250 level.
Bitcoin Cash Price Analysis
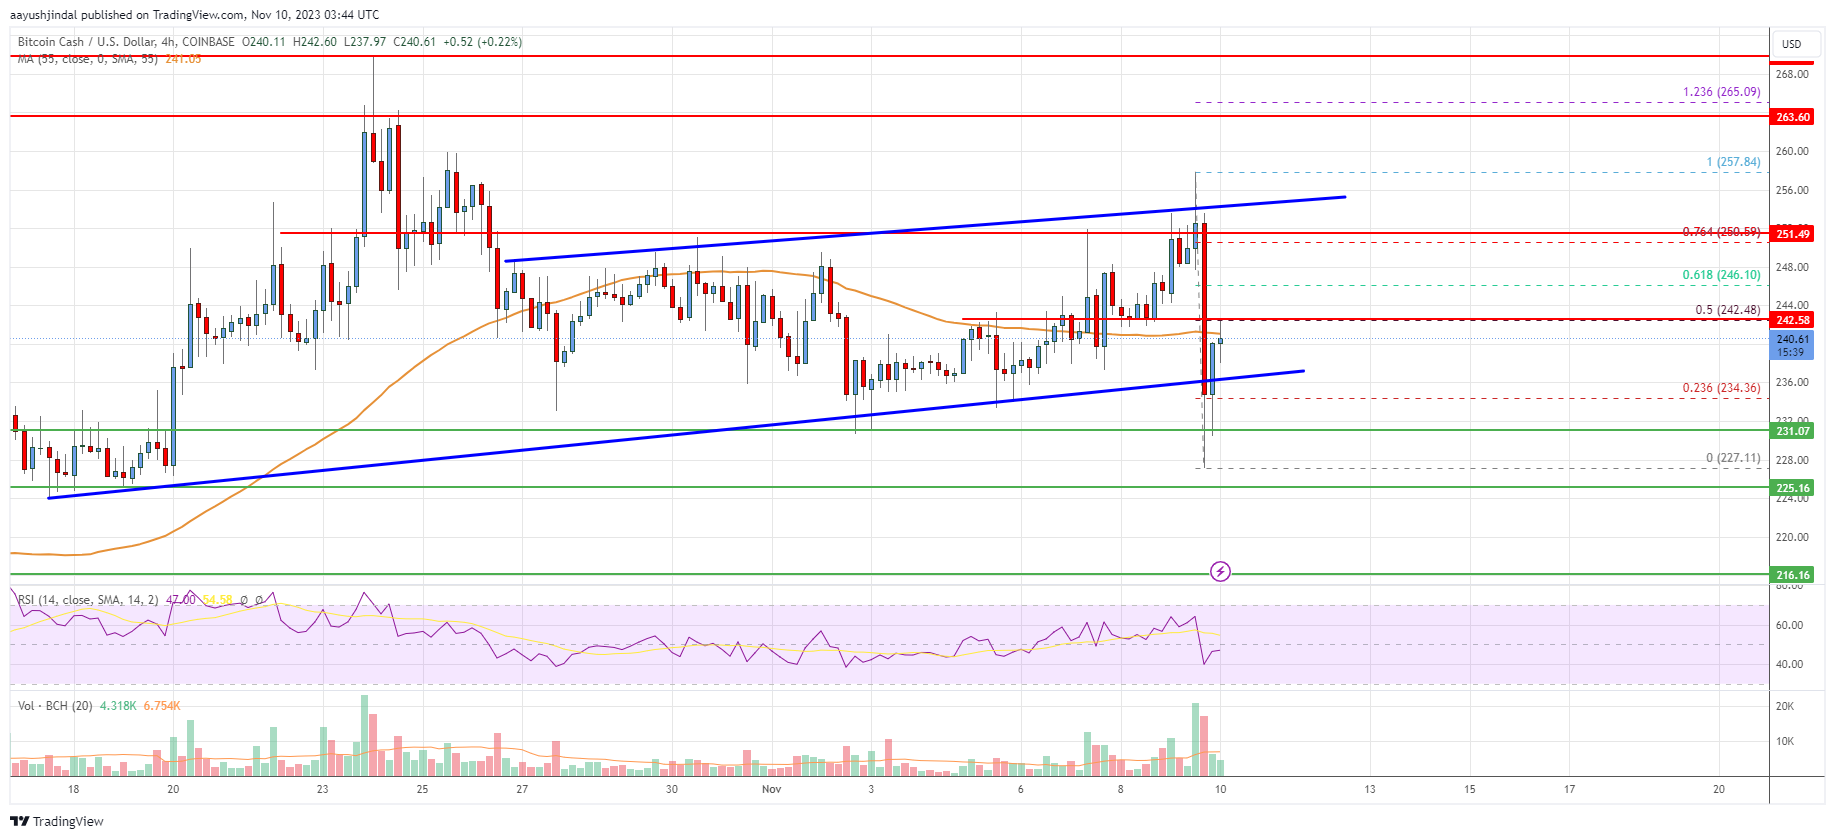
Bitcoin cash price started a fresh decline from the $258 resistance zone. BCH declined below the $245 support zone. It even spiked below the $230 support zone before the bulls appeared.
A low is formed near $227 and the price is now attempting a recovery wave. There was a move above the $232 and $235 resistance levels. The price surpassed the 23.6% Fib retracement level of the downward move from the $257.84 swing high to the $227.11 low.
Bitcoin cash is now trading below the $245 zone and the 55 simple moving average (4 hours). There is also a key rising channel forming with resistance near $255 on the 4-hour chart of the BCH/USD pair.
On the upside, the price is facing resistance near the $242 level. It is close to the 50% Fib retracement level of the downward move from the $257.84 swing high to the $227.11 low. The next major resistance is near the $250 level, above which the price may perhaps rise toward the $255 level.
Any more gains above $255 could set the pace for a move toward the $270 level. If not, the price might decline again. Immediate support on the downside is near the $235 level.
The first major support sits near the $230 level. The next major support is near $227, below which the bears might aim for $220 The next target for them may perhaps be near the $212 level.
Looking at the chart, Bitcoin Cash’s price is now trading below the $245 zone and the 55 simple moving average (4 hours). Overall, the price must clear $250 and $255 to start a steady upward movement in the near term.
Technical indicators
4 hours MACD – The MACD for BCH/USD is gaining pace in the bullish zone.
4 hours RSI (Relative Strength Index) – The RSI for BCH/USD is above the 50 level.
Key Support Levels – $235 and $230.
Key Resistance Levels – $250 and $255.