- Bitcoin cash price started a fresh decline from the $270 zone against the US Dollar.
- The price is now trading below the $250 zone and the 55 simple moving average (4 hours).
- There was a break below a key bullish trend line with support at $238 on the 4-hour chart of the BCH/USD pair (data feed from Coinbase).
- The pair could start a fresh decline if it stays below the $250 resistance zone.
Bitcoin cash price is struggling below the $250 zone against the US Dollar, unlike Bitcoin. BCH/USD could restart its decline if it fails near $245 or $250.
Bitcoin Cash Price Analysis
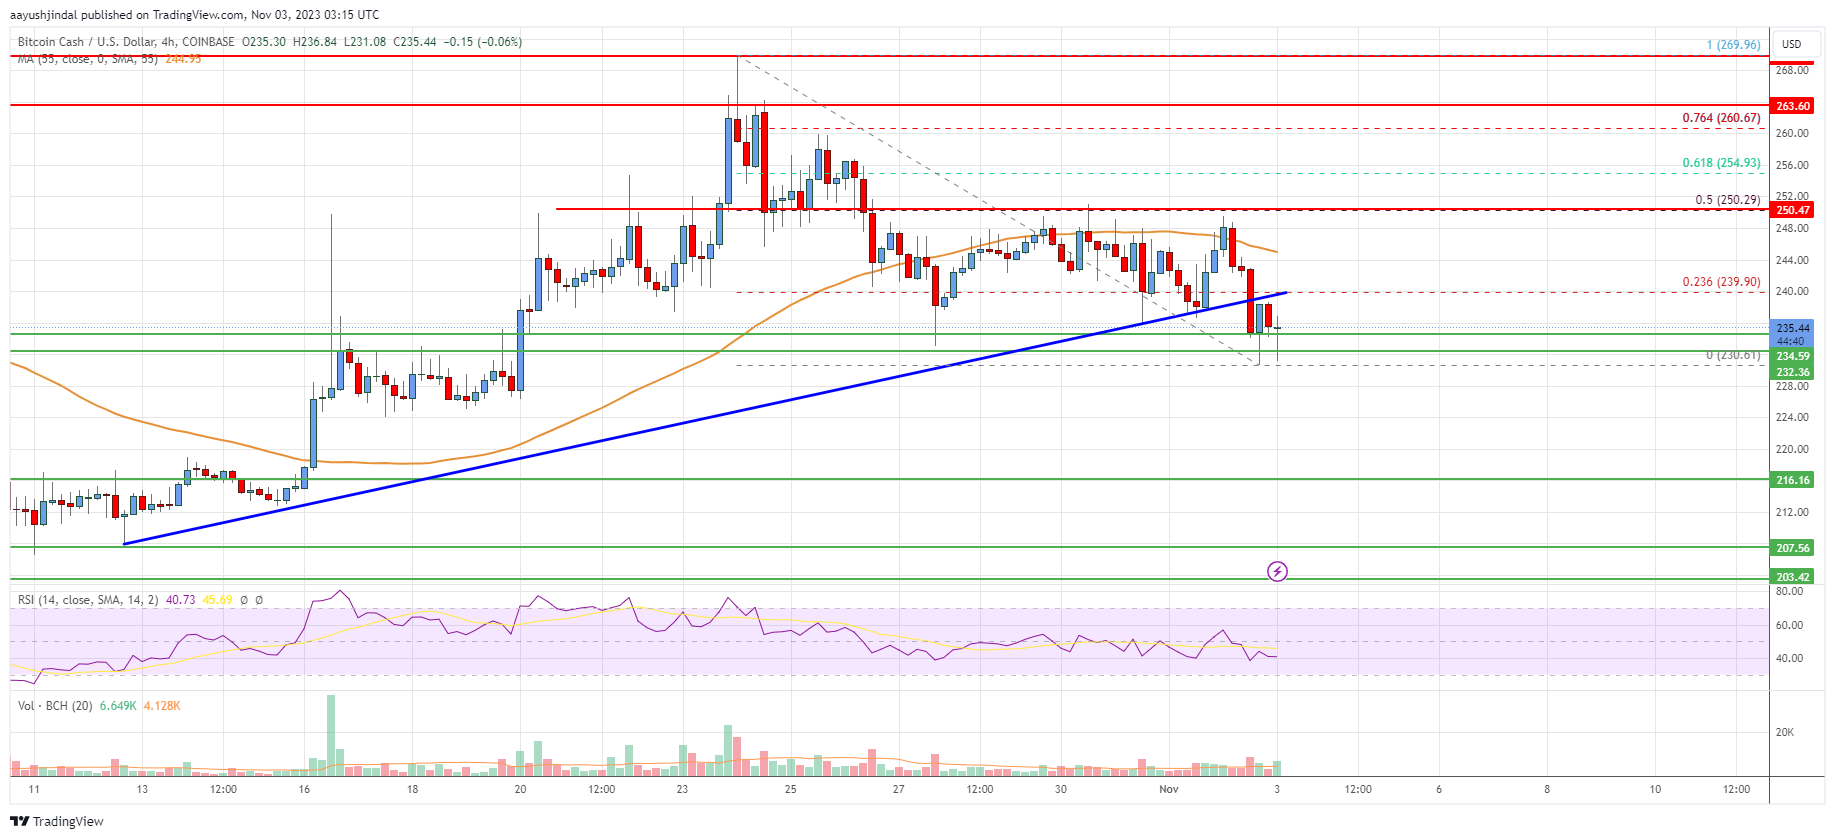
Bitcoin cash price struggled to continue higher above the $270 resistance zone. BCH traded as high as $269 before it started a fresh decline. There was a drop below the $265 and $262 support levels.
Besides, there was a break below a key bullish trend line with support at $238 on the 4-hour chart of the BCH/USD pair. It even dropped below the $250 support level. The price tested the $230 support. A low is formed near the $230.61 level and the price is now consolidating losses.
BCH is now trading below the $250 zone and the 55 simple moving average (4 hours). Immediate resistance is near the $240 level or the 23.6% Fib retracement level of the downward move from the $269 swing high to the $230 low.
The next key resistance is near the $250 zone. It is close to the 50% Fib retracement level of the downward move from the $269 swing high to the $230 low. Any more gains above $250 could set the pace for a move toward the $265 level.
If there is a move above the $265 resistance, the price could rise toward the $280 zone. If not, the price might continue lower below $230. Immediate support on the downside is near the $225 zone. The next major support is near the $215 level, below which the bears might aim for $207 or even $204.
Looking at the chart, Bitcoin cash price is now trading below the $250 zone and the 55 simple moving average (4 hours). Overall, the price could start a fresh decline if it stays below the $250 resistance zone.
Technical indicators
4 hours MACD – The MACD for BCH/USD is gaining pace in the bearish zone.
4 hours RSI (Relative Strength Index) – The RSI for BCH/USD is below the 50 level.
Key Support Levels – $230 and $215.
Key Resistance Levels – $240 and $250.