
- Bitcoin cash price started a downside correction from the $278 swing high against the US Dollar.
- The price is now trading above the $250 support and testing the 55 simple moving average (4-hours).
- There is a major contracting triangle forming with resistance near $260 on the 4-hours chart of the BCH/USD pair (data feed from Coinbase).
- The pair could either rally above the $260 resistance or it might dive below the $250 support.
Bitcoin cash price is struggling to gain momentum above $260, while bitcoin is surging against the US Dollar. BCH/USD is at risk of a downside break below $252 and $250.
Bitcoin Cash Price Analysis
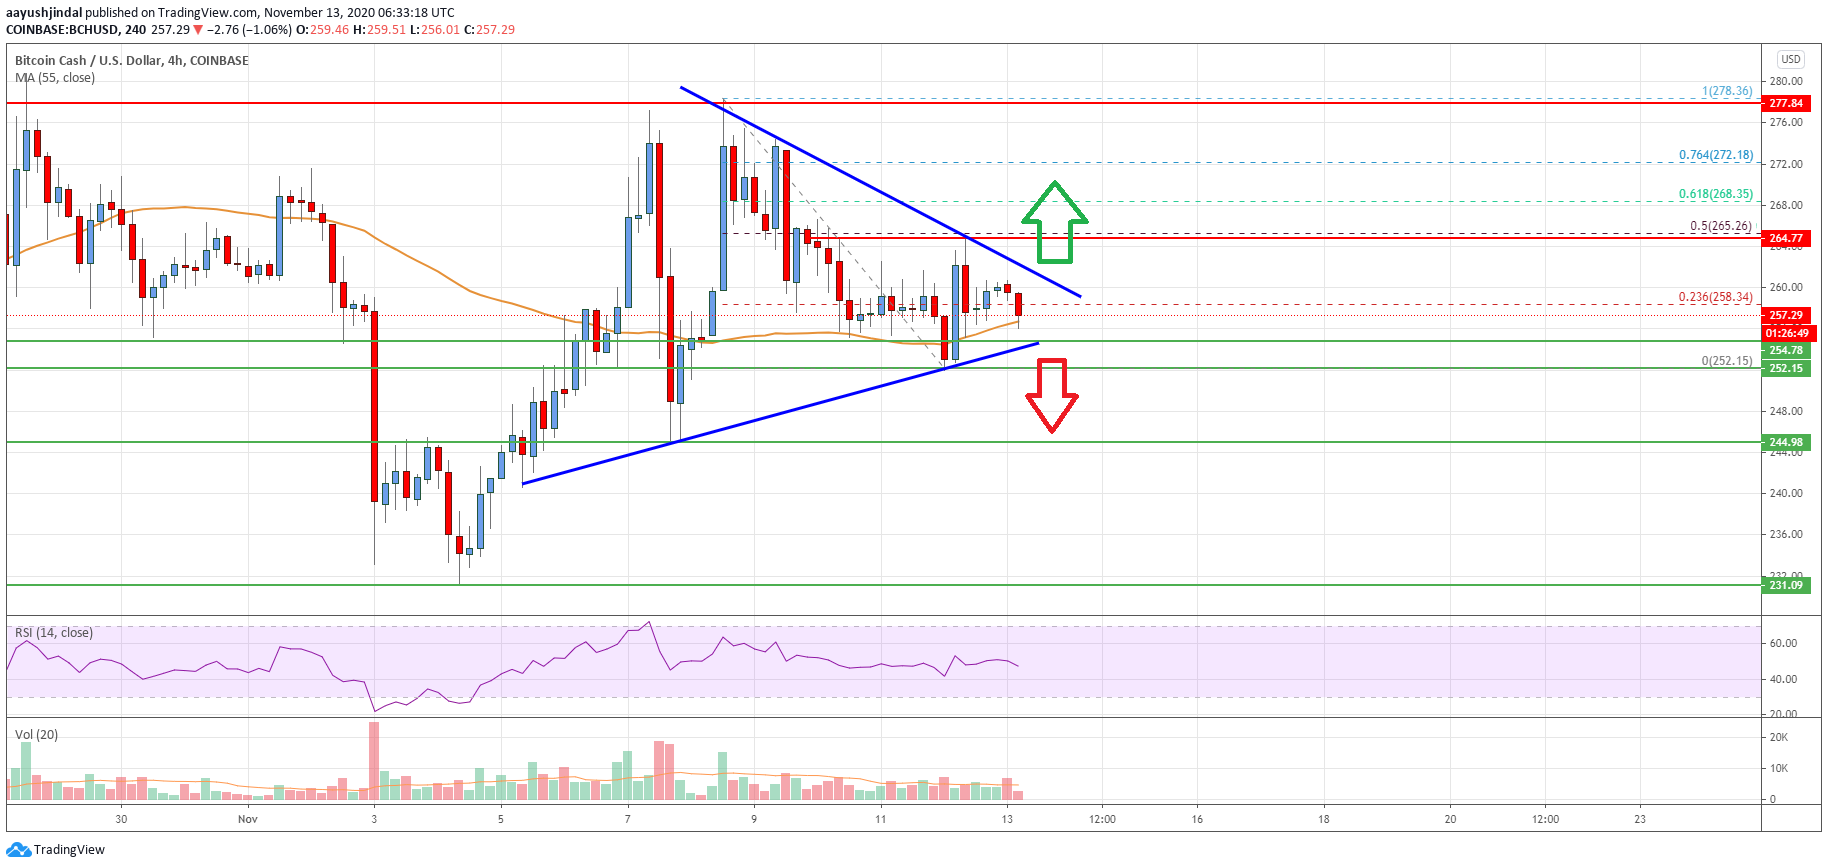
This week, bitcoin cash price failed to clear the $275 and $278 resistance levels against the US Dollar. BCH price started a fresh decline and traded below the $264 and $260 support levels.
The price even broke the $255 support, but it managed to stay above $252. The price is now trading above the $250 support and testing the 55 simple moving average (4-hours). A low is formed near $252 and the price is consolidating in a range.
It is trading near the 23.6% Fib retracement level of the downward move from the $278 swing high to $252 swing low. It seems like there is a major contracting triangle forming with resistance near $260 on the 4-hours chart of the BCH/USD pair.
If there is a break above the triangle resistance, the price could test the $265 barrier. It is close to the 50% Fib retracement level of the downward move from the $278 swing high to $252 swing low.
To continue higher, the price must surpass the $260 and $265 resistance levels. The next major resistance is seen near the $275 and $278 levels. Conversely, there is a risk of a downside break below the triangle support at $254.
An initial support on the downside is near $252. The main support is near the $250 level, below which the price might revisit the $232 support zone.
Looking at the chart, bitcoin cash price is clearing struggling below $260, but it is holding the $250 support. Overall, the price could either rally above the $260 resistance or it might dive below the $250 support.
Technical indicators
4 hours MACD – The MACD for BCH/USD is slowly losing pace in the bullish zone.
4 hours RSI (Relative Strength Index) – The RSI for BCH/USD is currently just below the 50 level.
Key Support Levels – $252 and $250.
Key Resistance Levels – $260 and $265.


Leave a Reply
You must be logged in to post a comment.