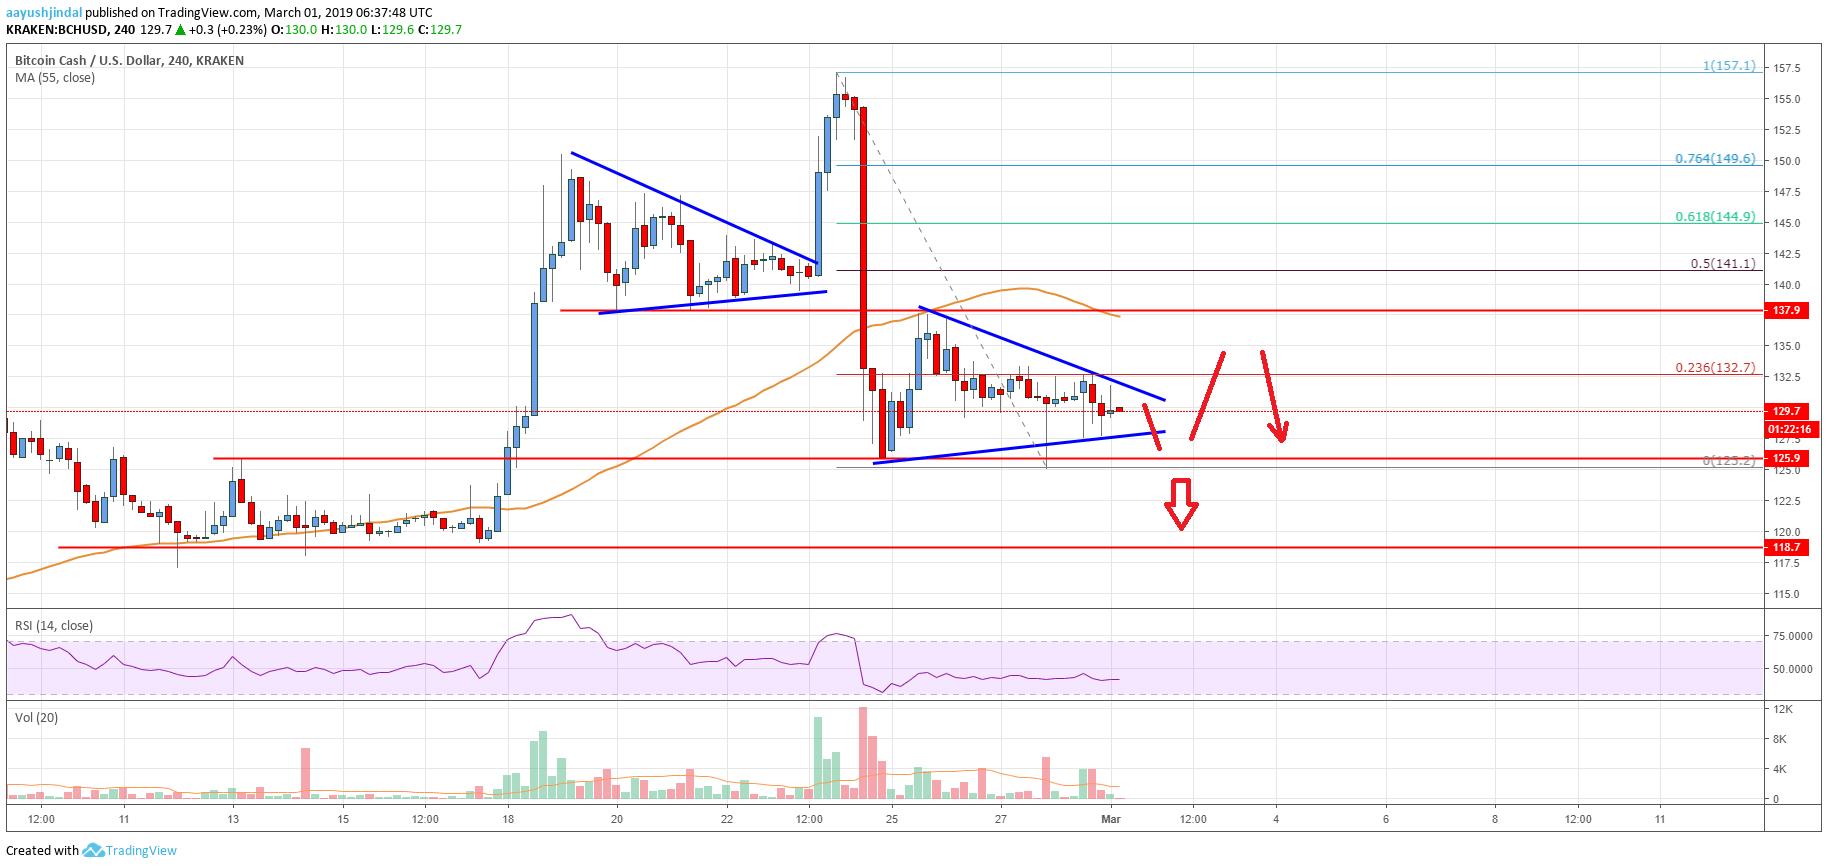
- Bitcoin cash price rallied above the $150 resistance level and topped near $157 against the US Dollar.
- The price trimmed most its gains and traded below the $150 and $140 support levels.
- There is a key triangle pattern in place with resistance at $133 on the 4-hours chart of the BCH/USD pair (data feed from Kraken).
- The pair is likely to make the next move either above $135 or below the $125 support.
Bitcoin cash price rallied above the $150 level before declining sharply below $140 against the US Dollar. BCH must stay above the $125 support to start a fresh upward move.
Bitcoin Cash Price Analysis
Recently, there were swing moves in bitcoin, ripple, Ethereum, and bitcoin cash rallied against the US Dollar. Earlier, the BCH/USD pair gained traction above the $145 and $150 resistance levels. The pair even broke the $155 level before sellers appeared near the $157 level. A crucial top was formed at $157 and later the price declined sharply. It broke the $150 and $145 support levels to move into a bearish zone. Finally, there was a close below the $140 support and the 55 simple moving average (4-hours).
The decline was protected by the $125 support and later the price started consolidating. An initial resistance is near the $132 zone and he 23.6% Fib retracement level of the last decline from the $157 high to $125 low. More importantly, there is a key triangle pattern in place with resistance at $133 on the 4-hours chart of the BCH/USD pair. If there is an upside break above $133, the price could test the $138 resistance. The 55 simple moving average (4-hours) is also positioned near the $138 level.
The next key resistance is near the $151 level. It represents the 50% Fib retracement level of the last decline from the $157 high to $125 low. On the other hand, if there is a downside break below the $125 support, the price could move further into a bearish zone. The next key support is at $118, below which the price may test $110.

Looking at the chart, bitcoin cash price is clearly preparing for the next move either above $135 or below the $125 support. The price action is positive and as long as BCH is above $125, it could trade above $133 and $138 in the near term.
Technical indicators
4 hours MACD – The MACD for BCH/USD is showing a few negative signs in the bearish zone.
4 hours RSI (Relative Strength Index) – The RSI for BCH/USD is currently well below the 50 level, with a bearish angle.
Key Support Levels – $125 and $118.
Key Resistance Levels – $133 and $138.


Leave a Reply
You must be logged in to post a comment.