- Bitcoin cash price rebounded nicely after buyers appeared near $120 against the US Dollar.
- The price climbed higher and broke the $125 and $130 resistance levels.
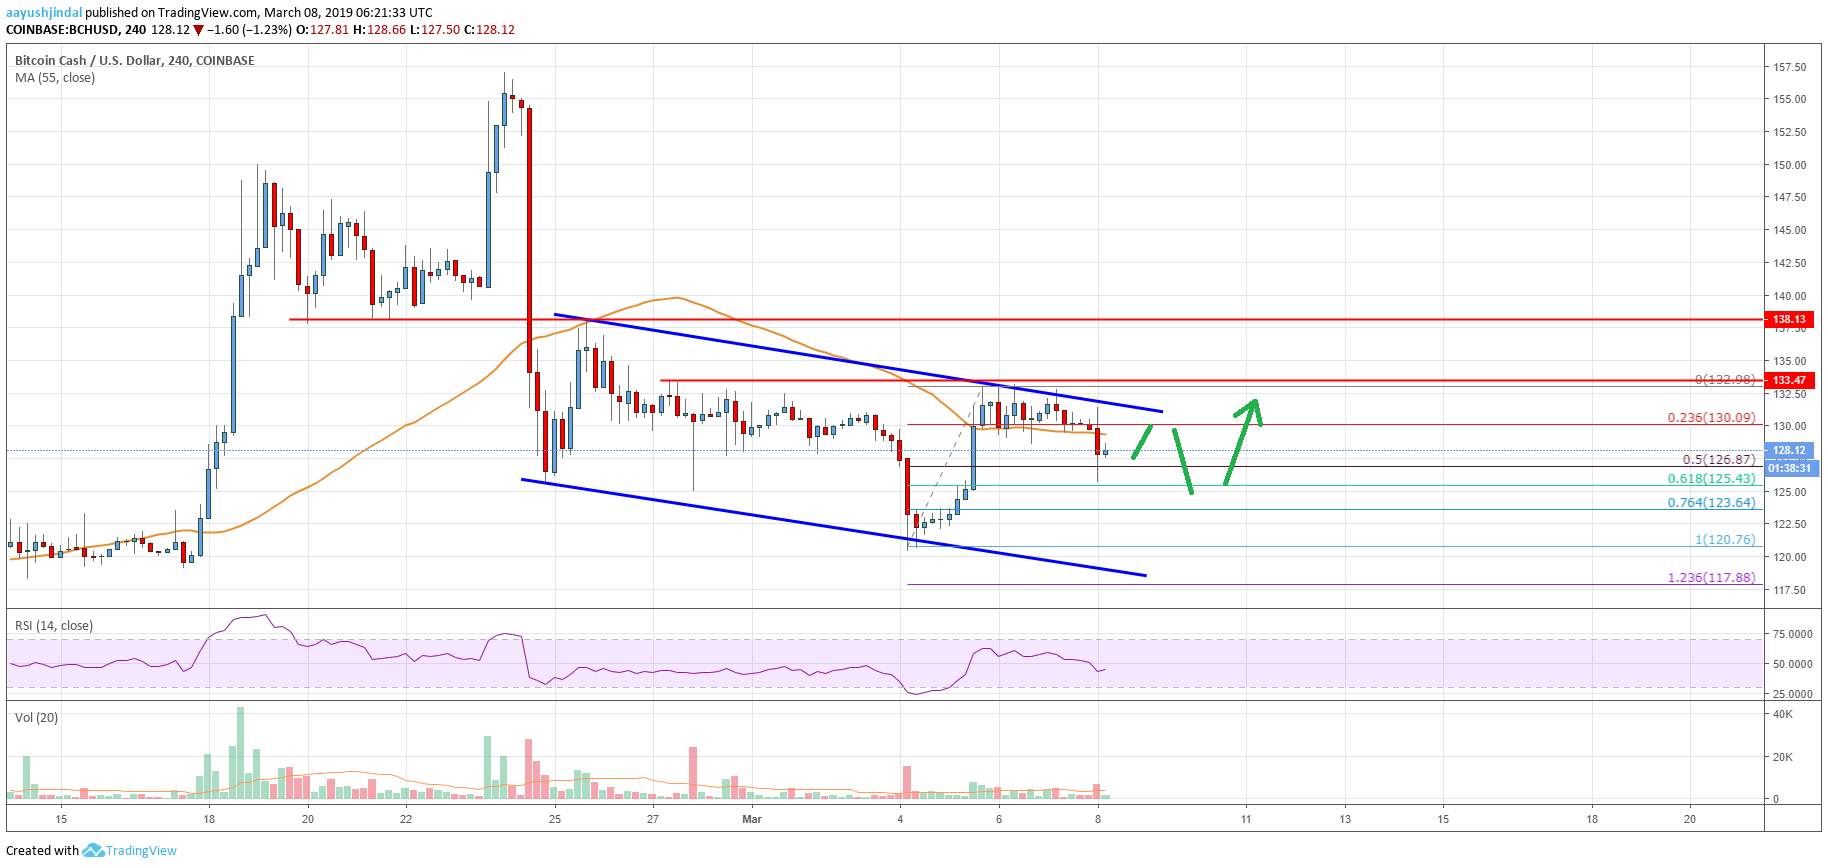
- There is a major declining channel is in place with resistance at $132 on the 4-hours chart of the BCH/USD pair (data feed from Kraken).
- The pair must break the $132-134 resistance zone to accelerate towards $140 and $145 in the near term.
Bitcoin cash price recovered nicely, but it struggled near $132 against the US Dollar. BCH might correct a few points before it could attempt to clear the $132 and $134 resistance levels.
Bitcoin Cash Price Analysis
Recently, there was a strong recovery in bitcoin, ripple, Ethereum, and bitcoin cash against the US Dollar. Earlier, the BCH/USD pair traded below the $125 and $124 support levels. There was even a close below the $125 support and the 55 simple moving average (4-hours). However, the $120 support area acted as a strong buy zone and prevented further losses. Finally, the price started a solid rebound and broke the $125 and $128 resistance levels. There was also a spike above the $132 resistance and the 55 simple moving average (4-hours).
A swing high was formed near $133 and the price started consolidating gains. It seems like there is a strong resistance formed near the $132-134 resistance zone. The price recently dipped below the 50% Fib retracement level of the last wave from the $120 swing low to $133 high. However, the $125 support area acted as a strong hurdle for sellers. It also represents the 61.8% Fib retracement level of the last wave from the $120 swing low to $133 high.
It seems like there is a major declining channel is in place with resistance at $132 on the 4-hours chart of the BCH/USD pair. A clear break above the channel resistance and $133 is needed for buyers to gain traction. The next key resistance is near the $138 level, which was a strong support earlier. If buyers push the price above $138, the next stop could be near the $145 level.

Looking at the chart, bitcoin cash price recovered nicely from $120, but it won’t be easy for buyers to clear the $132-134 resistance zone. Therefore, there are chances of a downside reaction towards the $125 or $124 support before the price could climb higher once again in the near term.
Technical indicators
4 hours MACD – The MACD for BCH/USD is showing positive signs and it could gain strength in the bullish zone.
4 hours RSI (Relative Strength Index) – The RSI for BCH/USD is about to move above the 50 level, with a bullish angle.
Key Support Levels – $125 and $120.
Key Resistance Levels – $133 and $138.


Leave a Reply
You must be logged in to post a comment.