
ETF outflows and rising volatility point to cautious sentiment as Bitcoin risks its worst Q1 since 2018.
Bitcoin may be set up for its worst Q1 close in eight years after losing over 22% of its value since the turn of the year. And as expected, this drop has strained the OG coin’s quarterly performance. More so, market data and derivatives activity all indicate that sentiment has flipped cautious.
ETF Redemptions Weigh on BTC as Price Struggles Below $70K
Bitcoin is trading around $68,000 after dropping from about $87,700 at the start of the year. CoinGlass data shows that only 2018 had a bigger first-quarter loss, with a 49.7% drop. Bitcoin has ended seven of the last thirteen first quarters with losses.
$BTC Currently on track for its worst Q1 since 2018.
The first quarter of the year is known for its volatile nature 5 out of the last 13 years, Q2 saw the same result as Q1 in terms of up/downside.
So it's safe to say, whatever happens in Q1 does not generally translate over… pic.twitter.com/Rj6yEyj5wn
— Daan Crypto Trades (@DaanCrypto) February 15, 2026
Last month, Bitcoin fell 10.2%, and it has dropped another 13.4% in February so far. For Bitcoin to avoid two straight months of losses, the price must rise above $80,000. In its history, the OG crypto has never had both January and February close in the red before. In fact, similar patterns were only seen during bear markets in 2018 and 2022.
Analyst Daan Trades Crypto said the first quarter often brings big price moves. Past data shows that a weak Q1 does not always mean the whole year will be bad. Even so, current losses are among the worst seen in the last eight years.
Institutional investors are adding pressure, with spot BTC ETFs seeing about $678 million in net outflows this month. Some trading days recorded more than $400 million in withdrawals. As per data, sector assets have fallen to around $87 billion, which pales in comparison to 2024 and early 2025.
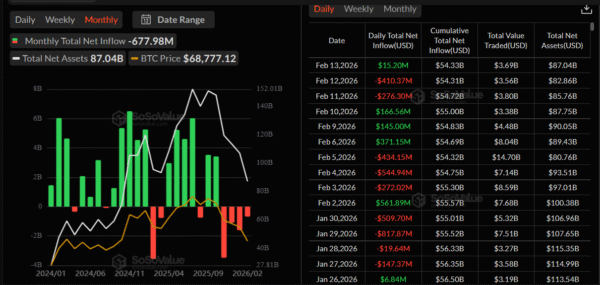
Image Source: SoSoValue
Because ETF redemptions require spot selling, capital exits feed directly into market supply. And this directly contributes to selling pressure. Market data suggests the decline is not driven by retail traders alone. Interestingly, larger funds are also reducing exposure amid ongoing economic uncertainty.
Bitcoin Correction Continues as Options Markets Signal Heightened Risk
Options markets show stress, with implied volatility at 53.9, higher than it has been 92% of the time over the past year. It is also nearly 12% above its 20-day average. For clarity, higher volatility usually means traders are more uncertain and buying protection.
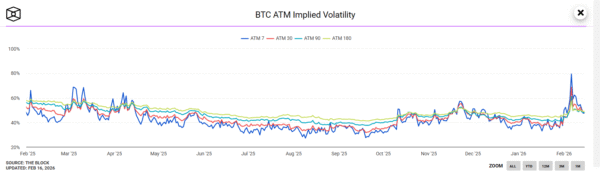
Image Source: TheBlock
Ether has fallen 34.3% so far in the first quarter, marking its third-worst Q1 performance on record. Over the past nine years, Ether has only ended three first quarters in negative territory. Notably, the current losses place the asset among its weaker historical starts.
Bitcoin’s MVRV ratio, which compares its market price to the average price investors paid, has moved back to normal levels. Extreme readings seen at past market tops are not present.
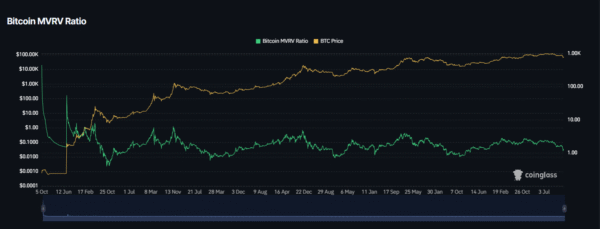
Image Source: CoinGlass
In deep bear markets, MVRV has fallen close to or below 1.0. Current levels are still above that zone, suggesting no full capitulation yet.
Nick Ruck, director at LVRG Research, described the decline as a regular correction phase. Long-term structure, he argued, remains intact despite short-term weakness. Price action supports the view of a valuation reset rather than a structural breakdown.
