
BTC price remains steady in Q3 around $110K, with analysts eyeing Q4 moves as support zones continue to hold firm.
Bitcoin has entered the final month of the third quarter with little price movement, leaving traders waiting for a decisive direction. The cryptocurrency is trading around $110,000 and has shown limited momentum since the beginning of July. Analysts are now focusing on the potential for sharp moves in the last quarter of the year.
Q3 Stagnation and Historical Trends
Market analysts note that Bitcoin has shown muted price activity through most of Q3, repeating a familiar seasonal pattern. Daan Crypto Trades posted on social media that “we’re 2 out of 3 months in and there’s been a lack of momentum in either direction for Bitcoin.” He also added that Q4 has often been the time when the largest moves occur.
$BTC Is essentially flat in Q3 so far.
We're 2 out of 3 months in and there's been a lack of momentum in either direction for Bitcoin. This has been similar for most of the past few years.
Q4 is when the explosive price action truly happens. Whether it's up or down, it usually… pic.twitter.com/ZmJlTJzF9b
— Daan Crypto Trades (@DaanCrypto) September 7, 2025
This lack of movement is not unusual, as Bitcoin has seen slow performance in past third quarters before strong swings in the final months. Many traders now expect the upcoming quarter to bring either a rally or deeper corrections. For now, the broader sentiment remains cautious while waiting for confirmation of the next trend.
Bitcoin Technical Picture Around Key Levels
On the daily chart, Bitcoin is holding near $110,000 after breaking below an ascending channel. This zone is close to the 100-day moving average, making it an important level for buyers to defend. The relative strength index is near 44, which shows weak momentum but no oversold pressure.
Analysts suggest that if $110,000 holds, price could move toward resistance levels at $116,000 and later $124,000. However, a clean break below this area could send the market back to the $104,000 demand zone. On the 4-hour chart, Bitcoin is testing the $110,000–$111,000 region, which has become the short-term pivot level for traders.
The short-term picture shows Bitcoin trading within a rising channel after escaping a steeper downtrend. The RSI on this timeframe is around 49, reflecting uncertainty and balanced pressure from both buyers and sellers. A push above $114,000 would strengthen bullish control, but a fall below $109,000 would challenge the current structure.
Support Retests and Onchain Accumulation
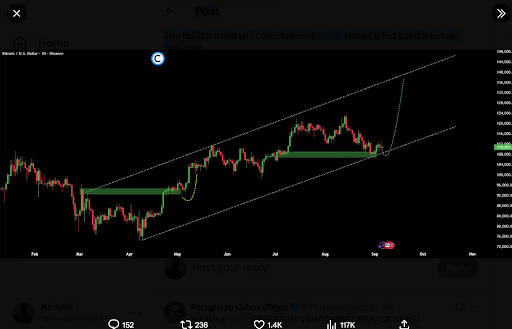
Some analysts see the current support retests as a healthy process within an ongoing bullish trend. Lau, a market observer, stated that “retesting support is always a good thing in a bullish trend,” noting that Bitcoin followed the same pattern before setting a new high in April. She added that the trend remains intact unless the asset closes a third candle under $98,000.
Onchain data also suggests long-term optimism despite the short-term slowdown. Exchange reserves continue to drop to multi-year lows as investors move Bitcoin off trading platforms. This trend points to accumulation and reduced sell-side pressure, which has often provided a base for future rallies.
With fewer coins available on exchanges, analysts suggest supply could tighten further once demand increases. This has historically supported strong recoveries after periods of weakness. As Q3 comes to an end, the market is closely watching whether this pattern repeats in the weeks ahead.
