
Bitcoin tests long-term average as capitulation fades and accumulation strengthens.
Bitcoin may be approaching a critical turning point. A technical model that tracks its SMA on a four-year scale suggests the asset is entering a phase that usually marks the end of bear markets. On-chain metrics and price action also seem to form setups seen in prior cycle bottoms. While confirmation is still developing, the structure appears more mature than fragile.
Bitcoin Revisits Historical Bottom Zone Around 4-Year SMA
For clarity, the 4-year SMA model compares Bitcoin’s daily price to its long-term average. It measures how far the price moves above or below that average. Basically, large gaps above the average often mean the market is overheated. When price moves back closer to the SMA, it usually signals that valuations are returning to normal.
In past cycles like 2014–2015, 2018–2019, and 2022–2023, Bitcoin peaked when price moved far above its long-term average. After that, the price slowly fell and moved back toward the 4-year SMA. Each bear market ended near that level, where Bitcoin traded sideways for several months before starting a new upward move.
📉 According to this metric, which is simply based on the 4 year SMA, we are reaching a bear market level.
This chart is built around that moving average and its multiples.
➡️ The higher the standard deviation, and therefore the multiple of the SMA, the more Bitcoin appears… pic.twitter.com/AJFHoJLkFW
— Darkfost (@Darkfost_Coc) February 15, 2026
As per market analyst Darkfost, the current market structure closely resembles past late bear phases. At present, Bitcoin has returned to the model’s green value zone. As a result, the price is approaching its 4-year SMA, currently near $57,500. Meanwhile, large moves far above the average have faded. The price is now gradually returning to its long-term average.
Historically, that zone has marked a shift from forced selling to quiet accumulation. However, valuation metrics alone cannot confirm a bottom. Additional signals are needed to assess whether bear-market exhaustion is developing.
Realized Loss Spikes and Falling Open Interest Hint at Late Bear Phase
Realized loss data shows several recent spikes, with daily losses reaching billions of dollars during market drops. These losses happen when investors sell coins below the price they paid. As a result, many of these sales reflect panic. In many cases, such heavy losses signal capitulation.
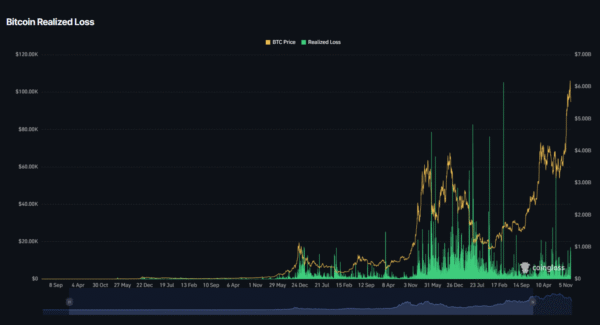
Image Source: CoinGlass
Large waves of realized losses have often appeared near past market bottoms. When those waves slow down, weak holders are usually pushed out of the market. Recently, realized losses jumped sharply, but price is not falling as fast as before.
Selling pressure looks weaker despite big loss numbers. Typically, this pattern often points to a late bear phase rather than the start of a deeper drop.
Total Bitcoin open interest is around $44 billion after a recent daily drop. Funding rates have eased, and trader positions look more balanced than during earlier highs.
Bear markets often reach a bottom after strong liquidations remove too many long positions from the market. Open interest has fallen from earlier highs, but it is still above levels seen at past cycle lows. Positions do not look overly bullish. At the same time, market stress is not extreme. From a market structure view, data points to a partial reset rather than active panic.
Long-Term Holder Supply and Capitulation Signals Hint at Bitcoin Bottom
Long-term holder behavior strengthens the case for maturation. Supply held for at least 155 days remains elevated. During past cycle tops, long-term holders reduced exposure and distributed coins. Bear markets reversed that pattern, as patient investors accumulated supply.
Market bottoms often formed when long-term holder supply reached cycle highs. Current data shows strong holders are keeping or increasing their coins despite volatility. This behavior points to accumulation, not selling. When price moves closer to the 4-year SMA while long-term holder supply remains high, it has often signaled a bottom-building phase in past cycles.
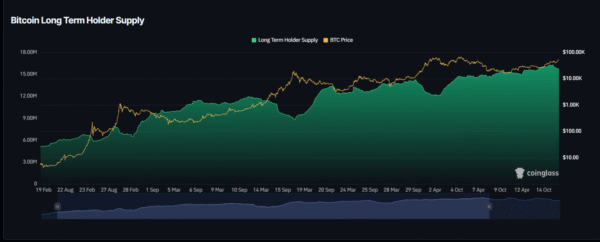
Image Source: CoinGlass
When viewed together, the signals show price moving back toward its long-term average. Realized losses suggest capitulation may have already happened. Meanwhile, open interest has fallen from cycle highs. At the same time, long-term holders continue to hold and add to supply.
However, none of these metrics alone guarantees a confirmed bottom. Open interest remains structurally elevated compared to earlier deep-cycle troughs. Broader liquidity conditions may still influence timing. Consolidation could persist before any sustained expansion emerges.
Even so, the structure no longer resembles early bear territory. Conditions instead resemble a mature compression phase. Downside asymmetry appears to be shrinking as accumulation gradually replaces distribution.
According to analysts, moving average models are often seen as too simple. However, when a model matches past cycle highs and lows and aligns with on-chain and derivatives data, it becomes difficult to dismiss.
If history repeats, price trading near the 4-year SMA, along with signs of capitulation and steady long-term accumulation, has often marked the final stage of a bear market.
