
- Bitcoin price failed to extend gains above $42,650 against the US Dollar.
- The price is now trading below $40,000 and the 55 simple moving average (4-hours).
- There was a break below a major bullish trend line with support near $40,500 on the 4-hours chart of the BTC/USD pair (data feed from Coinbase).
- The pair is likely to bounce back as long as it is above the $37,000 support zone.
Bitcoin price is slowly moving lower below $40,000 against the US Dollar. BTC could start a fresh increase unless there is a close below the $37,000 support.
Bitcoin Price Analysis
Bitcoin price extended its increase above the $40,000 resistance level. BTC even broke the $42,000 resistance level and spiked above $42,500.
However, the bulls protected additional gains above $42,650. A high was formed near $42,694 before the price started a fresh decline. There was a break below the $41,000 and $40,000 levels. The price declined below the 50% Fib retracement level of the upward move from the $38,339 swing low to $42,694 high.
There was also a break below a major bullish trend line with support near $40,500 on the 4-hours chart of the BTC/USD pair. It is now trading below $40,000 and the 55 simple moving average (4-hours). Besides, it is trading just below the $38,339 swing low.
An initial support on the downside is near the $37,300 level. It is near the 1.236 Fib extension level of the upward move from the $38,339 swing low to $42,694 high.
The main support is now forming near $37,000, below which there is a risk of a larger decline. The next major support could be near $35,000. On the upside, the first major resistance is near the $39,400 level and the 55 simple moving average (4-hours).
The main resistance is now forming near the $40,000 level. A close above the $40,000 zone is needed for a fresh increase.
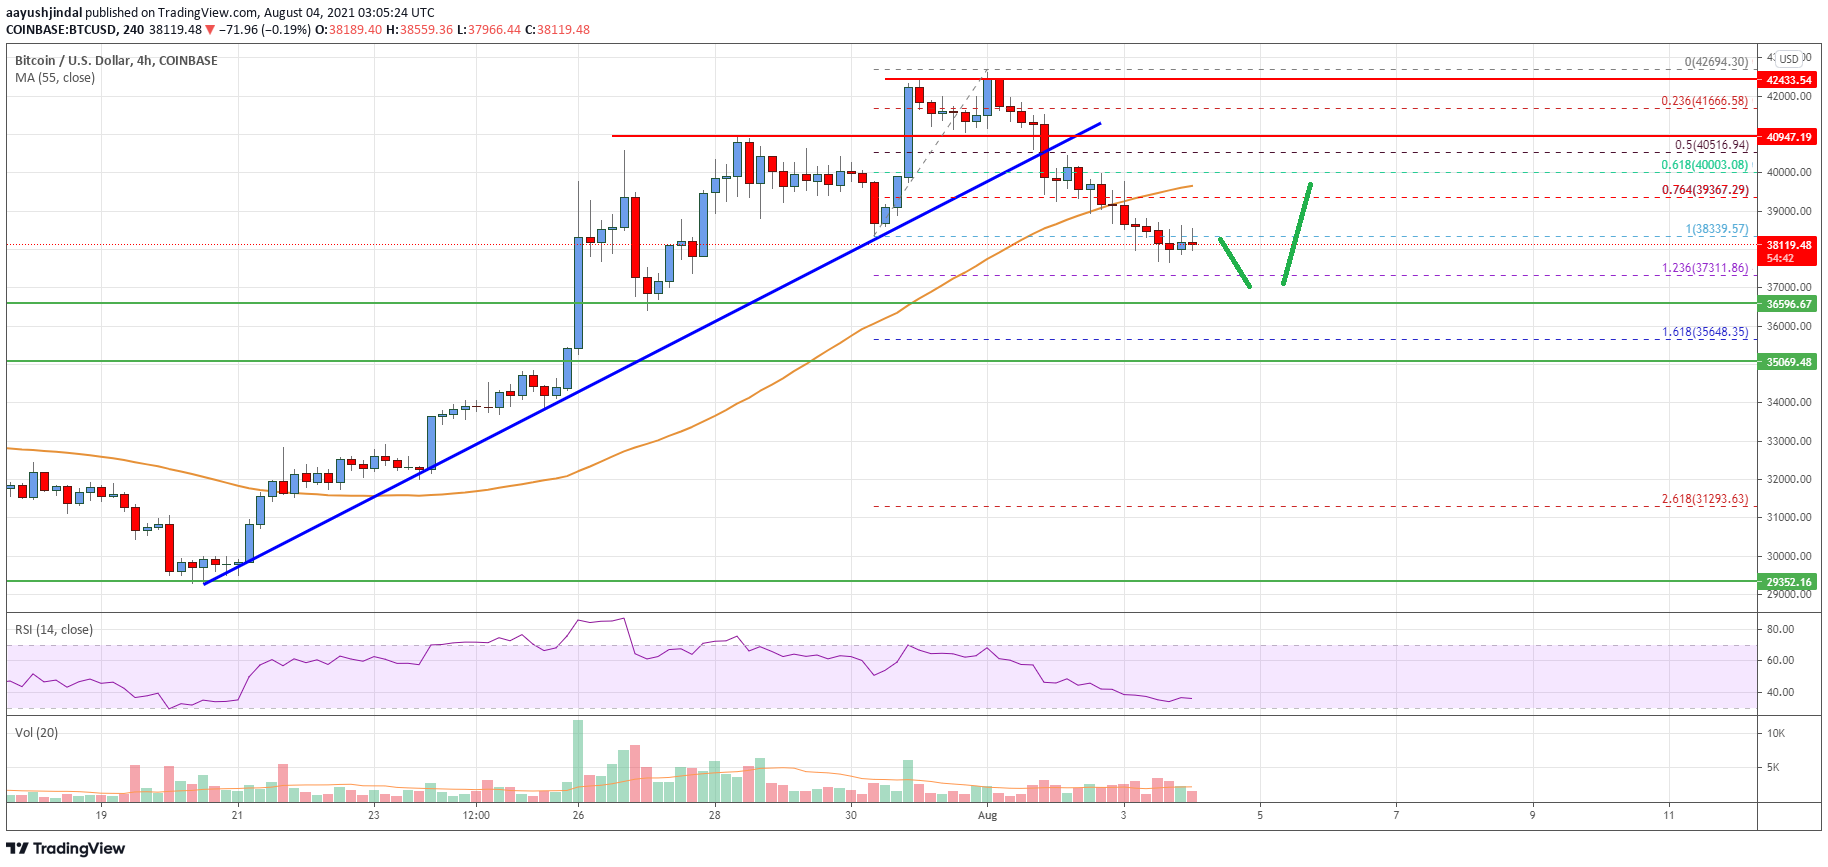
Looking at the chart, bitcoin price is clearly trading below $40,000 and the 55 simple moving average (4-hours). Overall, the price is likely to bounce back as long as it is above the $37,000 support zone in the near term.
Technical indicators
4 hours MACD – The MACD is now gaining momentum in the bearish zone.
4 hours RSI (Relative Strength Index) – The RSI is now well below the 50 level.
Key Support Levels – $37,300 and $37,000.
Key Resistance Levels – $39,400, $40,000 and $42,000.


Leave a Reply
You must be logged in to post a comment.