Key Points
- Bitcoin price topped near the $3,645 level and later declined against the US Dollar.
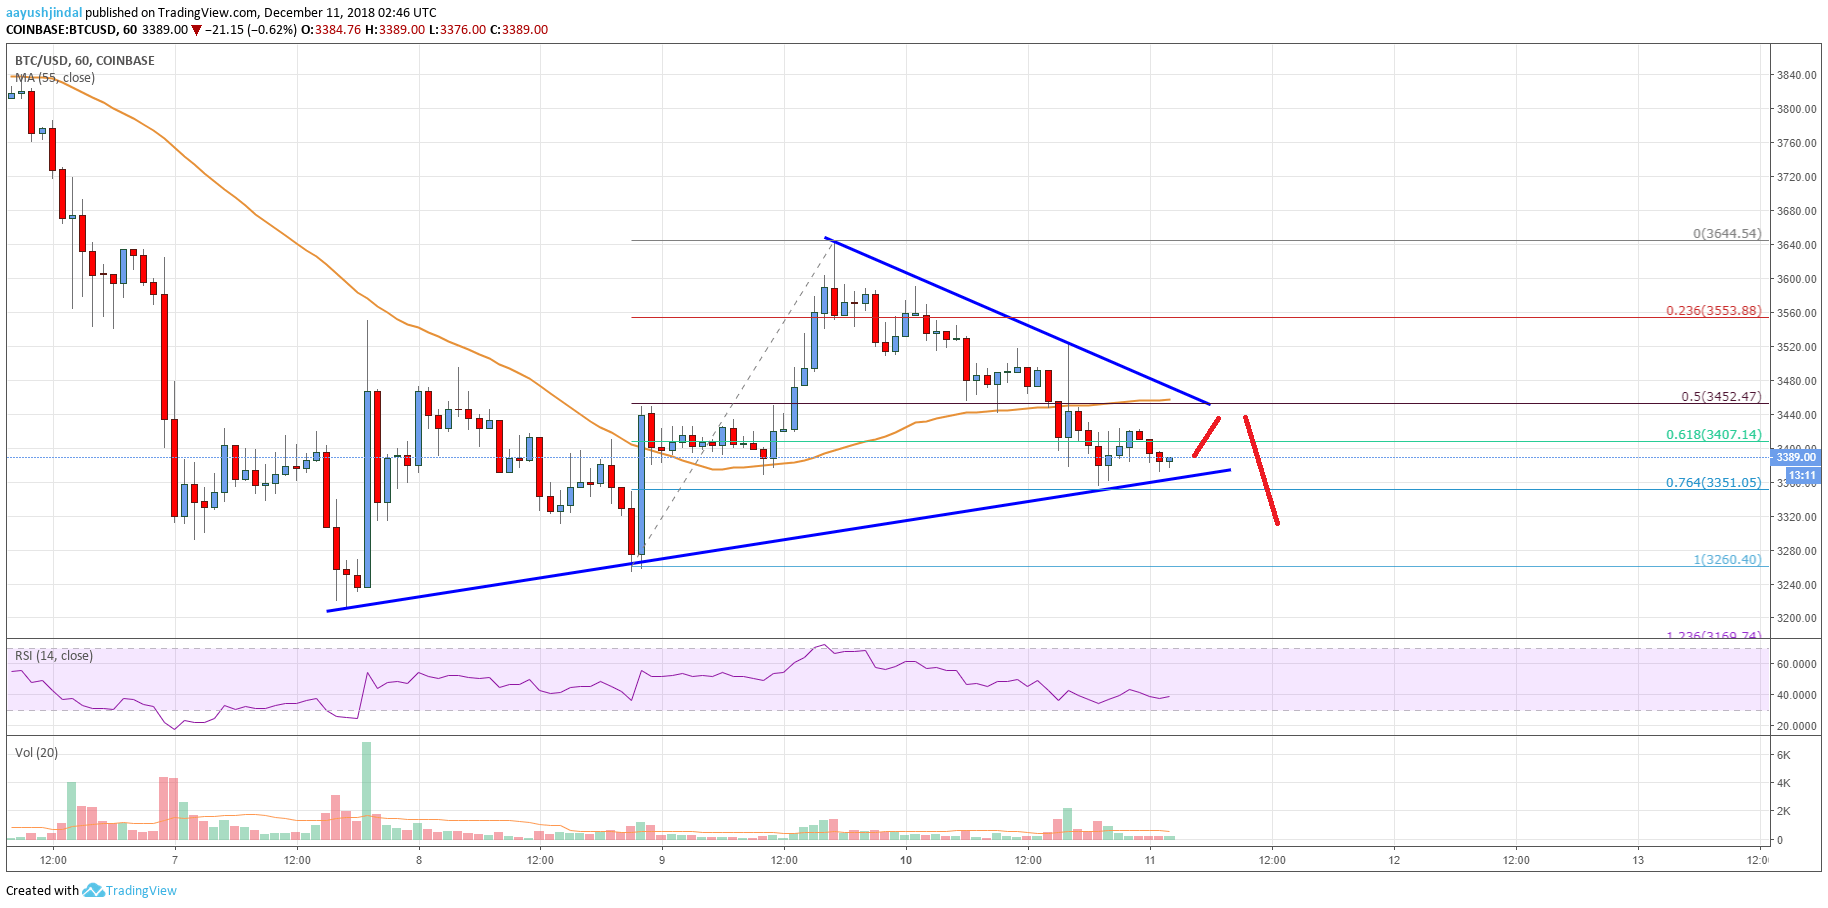
- There is a major bullish trend line formed with support at $3,355 on the hourly chart of the BTC/USD pair (data feed from Coinbase).
- The price is likely to extend the current decline below the $3,350 and $3,300 levels.
Bitcoin price is under pressure below $3,480 against the US Dollar. BTC is likely to break the $3,350-3,355 support for an extend decline to $3,260.
Bitcoin Price Analysis
After forming a support near the $3,260 level, bitcoin price climbed higher recently against the US Dollar. The BTC/USD pair traded above the $3,500 and $3,600 resistance levels. However, buyers struggled near the $3,640-45 zone. A high was formed near $3,645 and later the price declined. It moved down sharply and traded below the $3,600 and $3,550 support levels. There was even a close below the $3,500 level and the 55 hourly simple moving average.
Sellers pushed the price below the 61.8% Fib retracement level of the last wave from the $3,260 low to $3,644 high. At the moment, the price is trading near the key $3,350-55 support area. There is also a major bullish trend line formed with support at $3,355 on the hourly chart of the BTC/USD pair. The 76.4% Fib retracement level of the last wave from the $3,260 low to $3,644 high is at $3,351. Therefore, if there is a downside break below $3,350, the price is likely to decline sharply towards $3,260. Any further losses could take the price towards $3,200.

Looking at the chart, bitcoin price remains at a risk of more losses if sellers gain pace below $3,350. On the upside, the main resistance is near the $3,450 level, 55 SMA, and a bearish trend line.
Looking at the technical indicators:
Hourly MACD – The MACD for BTC/USD is placed in the bearish zone.
Hourly RSI (Relative Strength Index) – The RSI is well below the 50 level.
Key Support Level – $3,350
Key Resistance Level – $3,450


Leave a Reply
You must be logged in to post a comment.