- Bitcoin price started a downside correction from the $48,000 zone against the US Dollar.
- The price is now trading below $46,000 and the 55 simple moving average (4-hours).
- There is a major breakout pattern forming with support near $45,100 on the 4-hours chart of the BTC/USD pair (data feed from Coinbase).
- The pair could decline heavily if there is a clear move below $45,000 and $44,000.
Bitcoin price is struggling below the $47,000 resistance against the US Dollar. BTC could nosedive if there is a clear move below the $44,000 support.
Bitcoin Price Analysis
Bitcoin price gained pace for a move above the $45,000 resistance zone. BTC even climbed above the $46,000 level and the 55 simple moving average (4-hours).
However, the price struggled near $48,000 and recently started a downside correction. The price declined below the $47,000 and $46,000 levels. It traded as low as $44,411 and is currently consolidating losses. It is now trading below $46,000 and the 55 simple moving average (4-hours).
An immediate resistance on the upside is near the $45,800 level. It is near the 50% Fib retracement level of the downward move from the $47,200 swing high to $44,411 low.
The next major resistance on the upside is near the $46,550 level. It is near the 61.8% Fib retracement level of the downward move from the $47,200 swing high to $44,411 low. To start another increase, the price must settle above the $46,550 level in the near term.
The next major resistance could be $48,000, above which the price could rise to $50,000. If there is no upside break, the price might start a fresh decline below $45,200. There is also a major breakout pattern forming with support near $45,100 on the 4-hours chart of the BTC/USD pair.
The next key support is near the $44,000 level. Any more losses might call for a test of the key $42,500 support zone, where the bulls might take a stand.
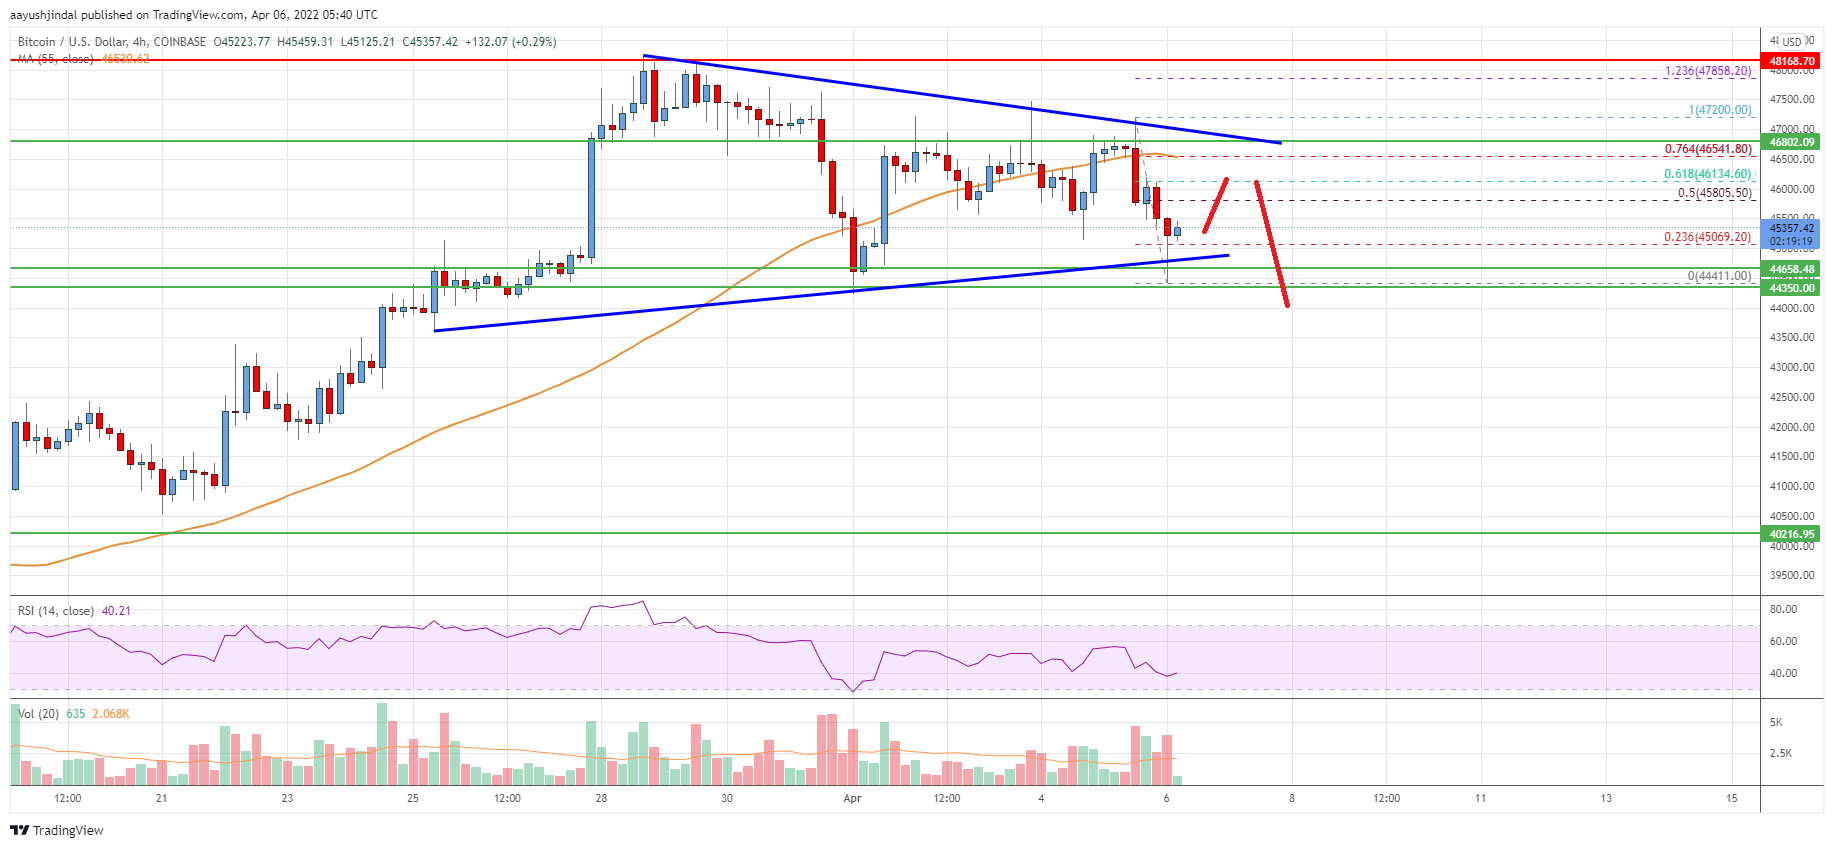
Looking at the chart, bitcoin price is clearly trading below $46,000 and the 55 simple moving average (4-hours). Overall, the price could decline heavily if there is a clear move below $45,000 and $44,000.
Technical Indicators
4 hours MACD – The MACD is now losing momentum in the bearish zone.
4 hours RSI (Relative Strength Index) – The RSI is now below the 50 level.
Key Support Levels – $45,000 and $44,000.
Key Resistance Levels – $45,800, $46,550 and $48,000.
