- Bitcoin price started a fresh increase from the $42,000 zone against the US Dollar.
- The price is now trading above $45,000 and the 55 simple moving average (4-hours).
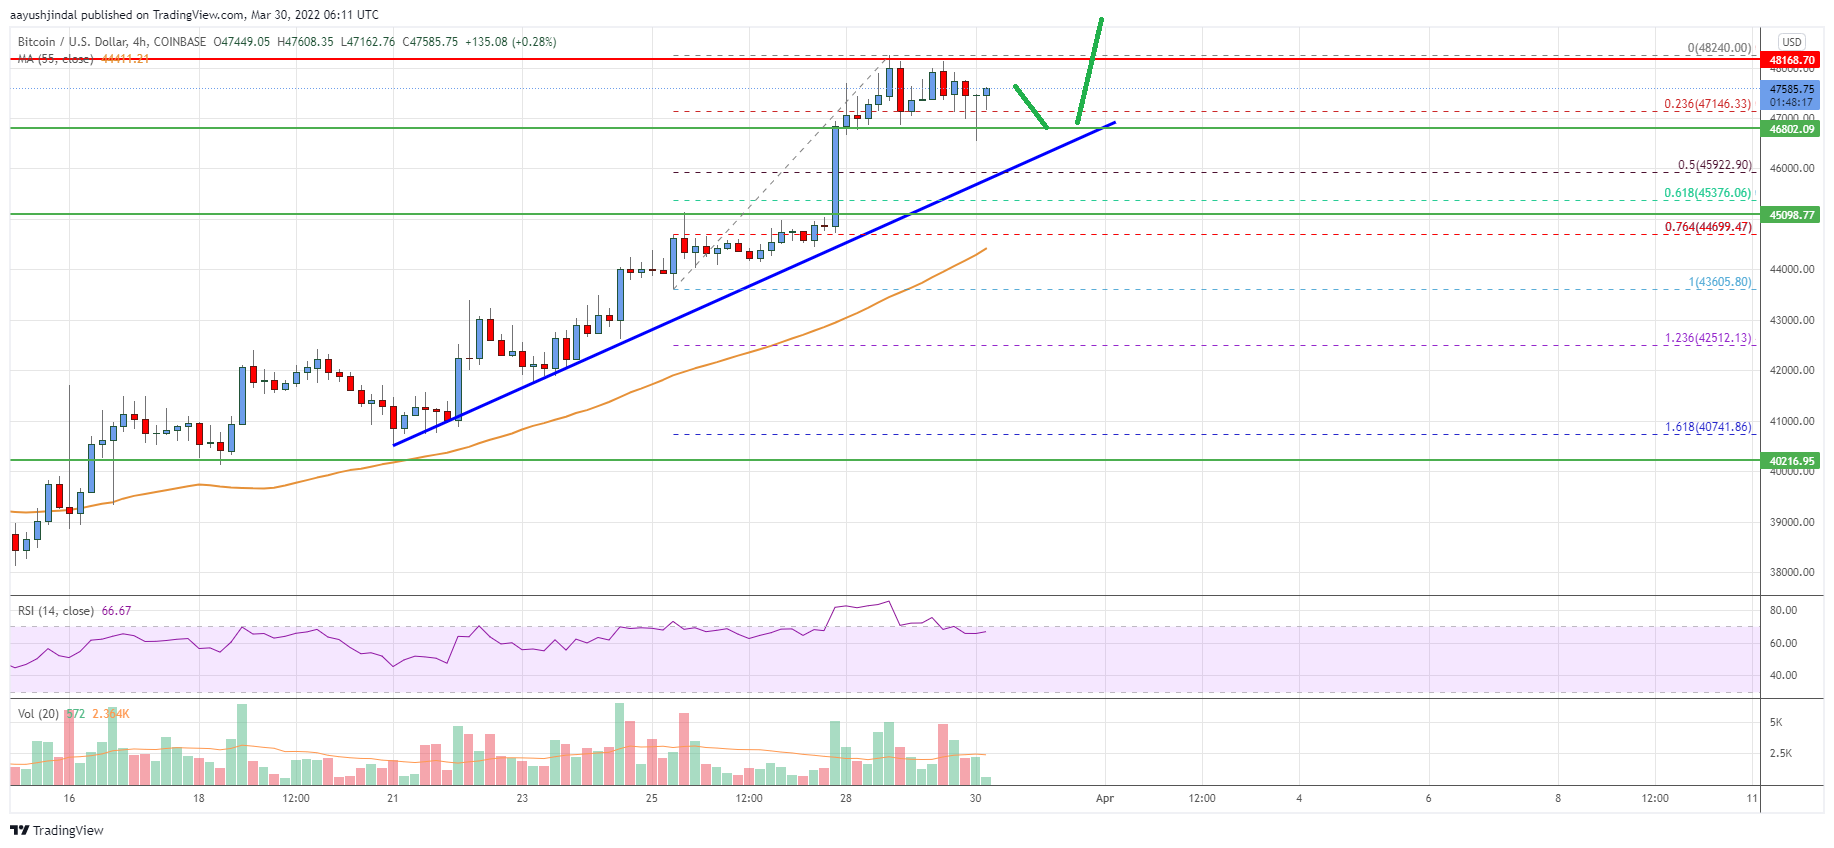
- There is a key bullish trend line forming with support near $46,400 on the 4-hours chart of the BTC/USD pair (data feed from Coinbase).
- The pair must clear $48,000 and then $48,200 to start another increase in the near term.
Bitcoin price is eyeing an upside break above the $48,000 resistance against the US Dollar. BTC could rally if there is a clear move above $48,000 and $48,200.
Bitcoin Price Analysis
Bitcoin price formed a base above the $42,000 level. As a result, BTC started a decent increase and broke many hurdles near the $43,500 level.
The price even gained pace above the $45,000 resistance and the 55 simple moving average (4-hours). The bulls remained in action there was a move above $47,000. The price is now facing resistance near the $48,000 and $48,200 levels.
The next major resistance on the upside is near the $48,850 level. To start another increase, the price must settle above the $48,850 level in the near term. The next major resistance could be $49,500, above which the price could rise to $50,000.
If there is no upside break, the price might start a downside correction below $47,350. An initial support is near the $47,150 level. It is near the 23.6% Fib retracement level of the upward move from the $43,605 swing low to $48,240 high.
There is also a key bullish trend line forming with support near $46,400 on the 4-hours chart of the BTC/USD. The next key support is near the $46,000 level and the 50% Fib retracement level of the upward move from the $43,605 swing low to $48,240 high.
Any more losses might call for a test of the key $44,200 support zone and the 55 simple moving average (4-hours), where the bulls might take a stand.

Looking at the chart, bitcoin price is clearly trading above $45,000 and the 55 simple moving average (4-hours). Overall, the price must clear $48,000 and then $48,200 to start another increase in the near term.
Technical Indicators
4 hours MACD – The MACD is now gaining momentum in the bullish zone.
4 hours RSI (Relative Strength Index) – The RSI is now above the 50 level.
Key Support Levels – $47,150 and $46,400.
Key Resistance Levels – $48,200, $48,850 and $50,000.


Leave a Reply
You must be logged in to post a comment.