
- Bitcoin price started a fresh decline from the $42,600 zone against the US Dollar.
- The price is now trading below $40,000 and the 55 simple moving average (4-hours).
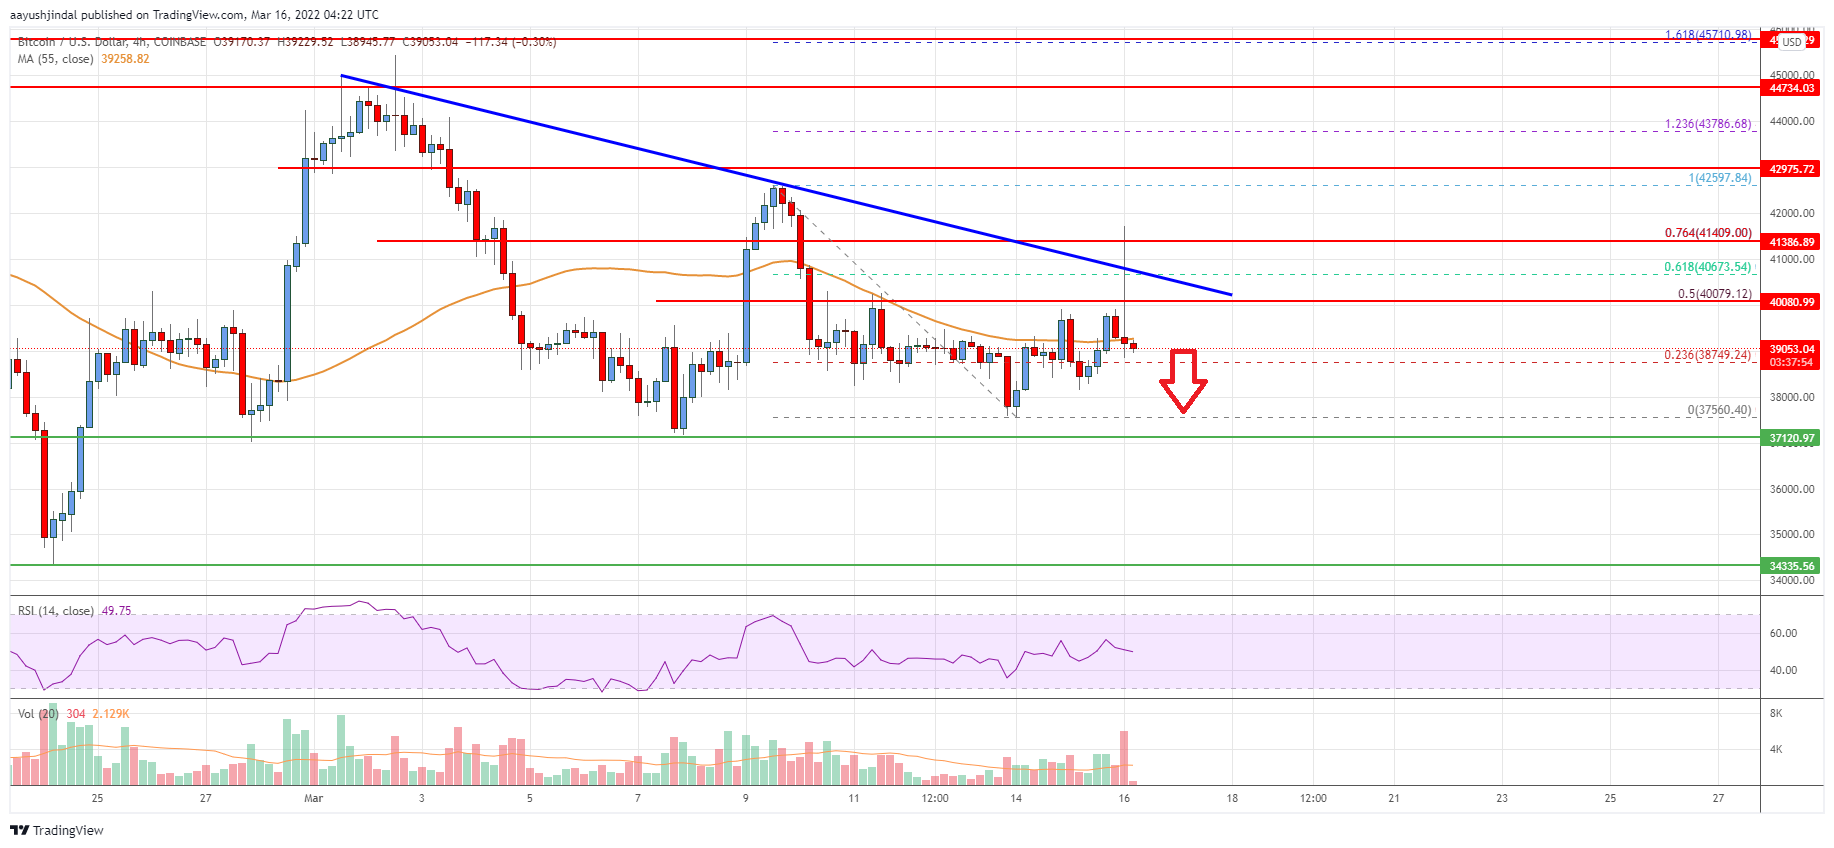
- There is a major bearish trend line forming with resistance near $40,100 on the 4-hours chart of the BTC/USD pair (data feed from Coinbase).
- The pair must clear $40,000 and then $40,800 to start a fresh increase in the near term.
Bitcoin price is struggling to settle above the $40,000 resistance against the US Dollar. BTC even spiked above $41,000, but it failed to stay in the positive zone.
Bitcoin Price Analysis
Bitcoin price formed a base above the $37,500 level. As a result, BTC started a decent increase and broke many hurdles near the $39,500 level.
The price even spiked above the $40,000 resistance and the 55 simple moving average (4-hours). There was a move above the 50% Fib retracement level of the key decline from the $42,597 swing high to $37,560 swing low.
Finally, there was a move above the $41,000 resistance level. However, the price struggled near $41,500. Bitcoin tested the 76.4% Fib retracement level of the key decline from the $42,597 swing high to $37,560 swing low. It seems like the price struggled to continue higher and there was a sharp bearish reaction from $41,500.
It is now trading below $40,000 and the 55 simple moving average (4-hours). On the upside, an immediate resistance is near the $39,500 level.
The next major resistance on the upside is near the $40,000 level. There is also a major bearish trend line forming with resistance near $40,100 on the 4-hours chart of the BTC/USD pair. To start another increase, the price must settle above the $40,000 level in the near term.
The next major resistance could be $41,500, above which the price could rise to $42,500. If there is no upside break, the price might start a decline below the $39,000 level.
The next key support is near the $38,000 level, below which there is a risk of a move towards the $37,560 level. Any more losses might call for a test of the key $34,250 support zone.
Looking at the chart, bitcoin price is clearly trading below $40,000 and the 55 simple moving average (4-hours). Overall, the price must clear $40,000 and then $40,800 to start a fresh increase in the near term.
Technical Indicators
4 hours MACD – The MACD is now gaining momentum in the bearish zone.
4 hours RSI (Relative Strength Index) – The RSI is now near the 50 level.
Key Support Levels – $39,000 and $38,000.
Key Resistance Levels – $39,500, $40,000 and $40,800.


Leave a Reply
You must be logged in to post a comment.