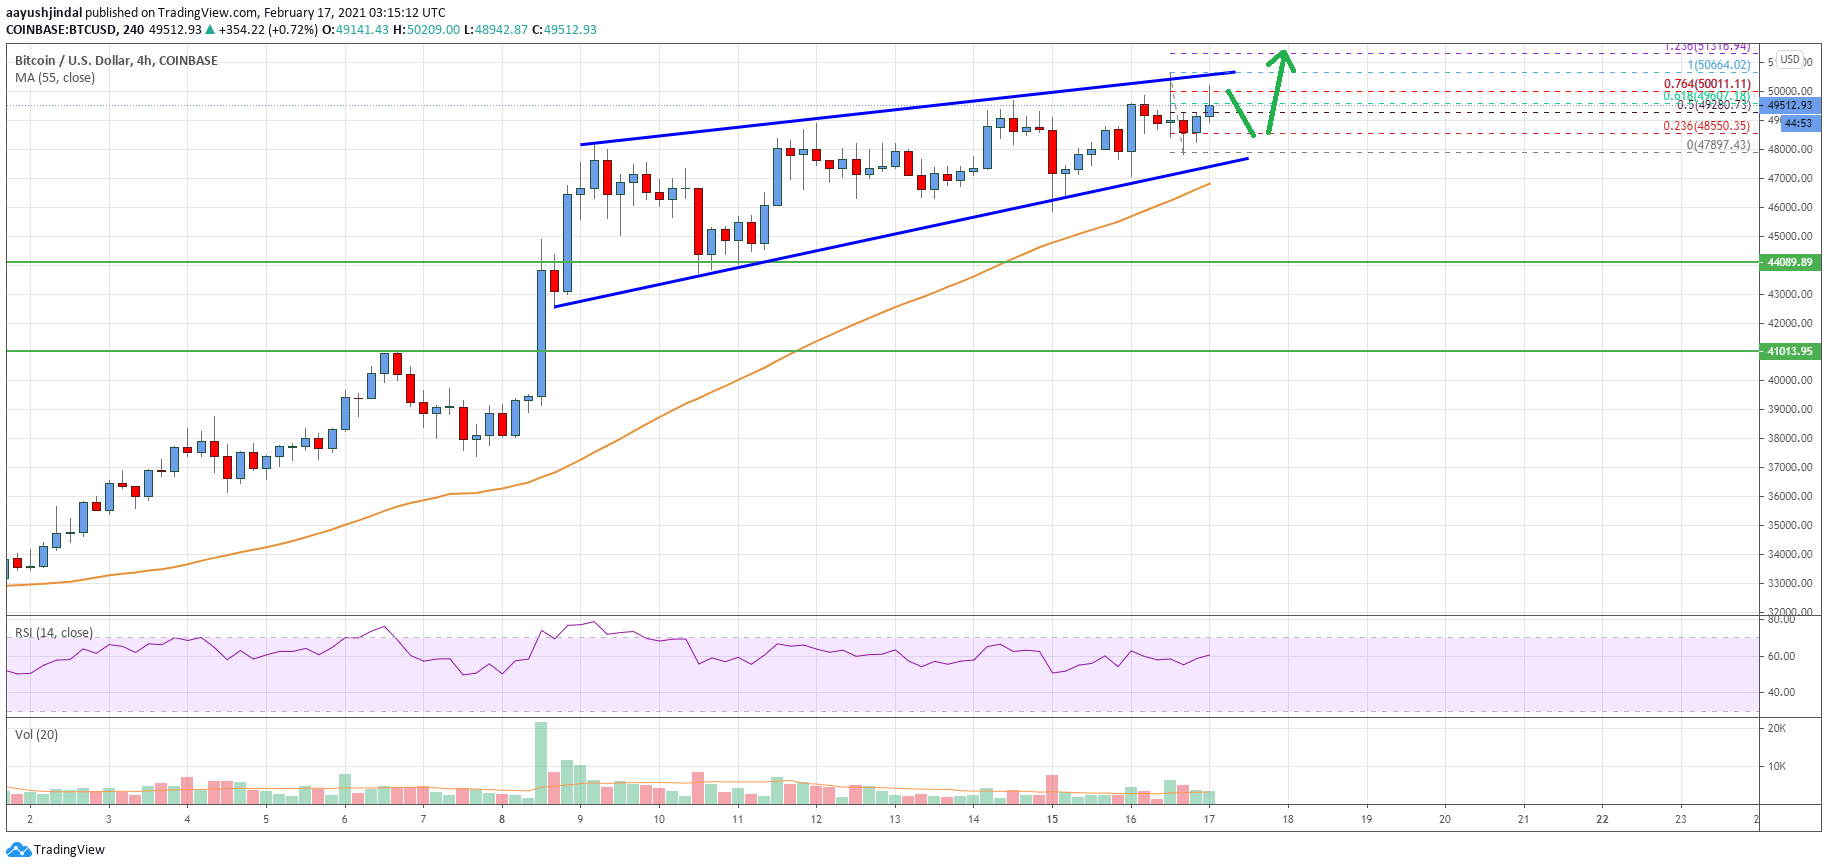
- Bitcoin price rallied to a new all-time high near $50,665 against the US Dollar.
- The price is now consolidating above $48,500 and the 55 simple moving average (4-hours).
- There is a major contracting triangle forming with resistance near $50,600 on the 4-hours chart of the BTC/USD pair (data feed from Coinbase).
- The pair is likely to surge above $51,000 as long as there is no break below the $48,000 support.
Bitcoin price is trading in a strong uptrend above $48,000 against the US Dollar. BTC is showing positive signs and the bulls are likely to aim a break above the $51,000 level.
Bitcoin Price Analysis
In the past few days, there was a steady increase in bitcoin price above the $48,000 support zone against the US Dollar. BTC broke the $49,000 and $49,500 resistance levels to move further into a positive zone.
Finally, it cleared the $50,000 mark for the first time. A new all-time high was formed near $50,665 before there was a downside correction. The price dipped below the $50,000 and $49,000 levels. However, the bulls were able to protect the $48,000 support zone.
A low was formed near $47,900 before the price started a fresh increase. It broke the $49,500 resistance and settled above the 50% Fib retracement level of the recent drop from the $50,665 high to $47,900 swing low.
The price is now showing a lot of positive signs near the $50,000 level. It is also testing the 76.4% Fib retracement level of the recent drop from the $50,665 high to $47,900 swing low. It seems like there is a major contracting triangle forming with resistance near $50,600 on the 4-hours chart of the BTC/USD pair.
If there is a clear break above the triangle resistance and $50,665, there are chances of a strong increase. In the stated case, the price will most likely rally above the $51,000 level.
Conversely, there could be another downside correction below the $49,500 support. The main support is forming near the $48,000 level and the triangle lower trend line. Any more losses might lead the price towards the $45,000 level.

Looking at the chart, bitcoin price is clearly trading well above $48,000 and the 55 simple moving average (4-hours). Overall, the price is likely to surge above $51,000 as long as there is no break below the $48,000 support.
Technical indicators
4 hours MACD – The MACD is now gaining momentum in the bullish zone.
4 hours RSI (Relative Strength Index) – The RSI is well above the 50 level.
Key Support Levels – $48,500 and $48,000.
Key Resistance Levels – $50,600, $52,000 and $55,000.


Leave a Reply
You must be logged in to post a comment.