
- Bitcoin price started a fresh increase above the $26,000 zone against the US Dollar.
- The price is now trading below $28,000 and the 55 simple moving average (4-hours).
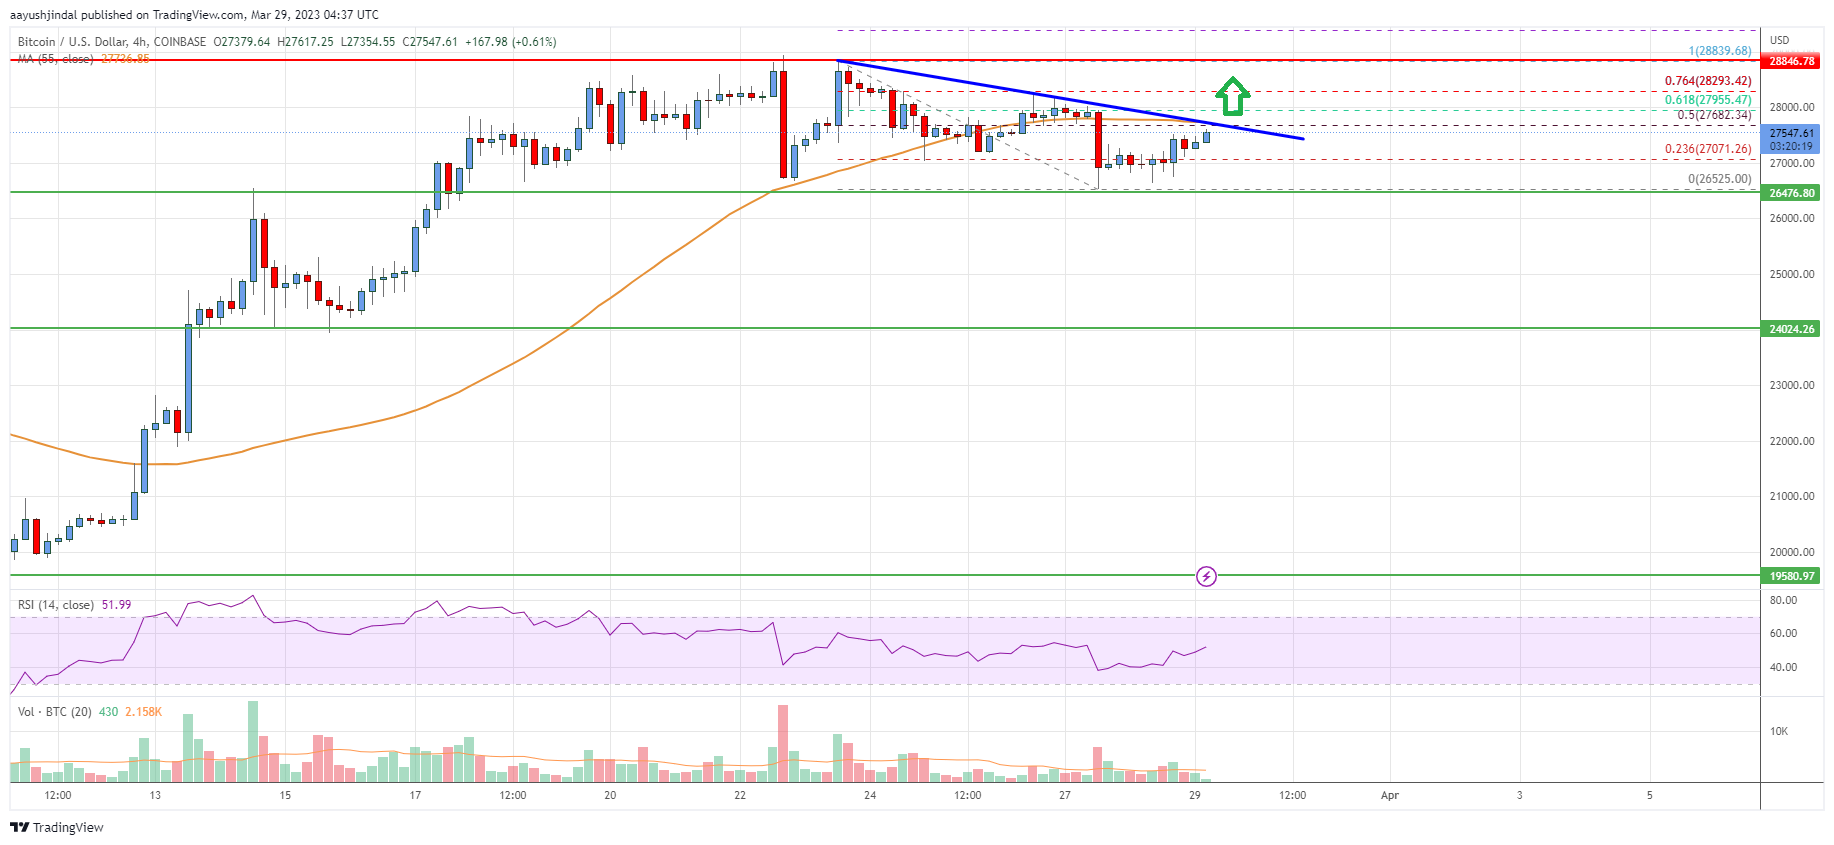
- There is a key bearish trend line forming with resistance near $27,800 on the 4-hours chart of the BTC/USD pair (data feed from Coinbase).
- The pair could continue to rise if there is a clear move above $28,000 level.
Bitcoin price is showing positive signs above $27,000 against the US Dollar. BTC might gain bullish momentum if there is a clear move above the $28,000 zone.
Bitcoin Price Analysis
Bitcoin price started a steady increase from the $25,000 support zone. The price gained and cleared many hurdles near the $26,500 and $27,000 levels.
There was a clear move above the $28,000 level and the 55 simple moving average (4-hours). However, the bears were active near the $28,800 zone. A high was formed near $28,839 before there was a downside correction. The price traded below $27,500, but the bulls were active near $26,500.
A low is formed near $26,525 and the price is now rising. It cleared the 23.6% Fib retracement level of the downward move from the $28,839 swing high to $26,525 low.
The price is now trading below $27,800 and the 55 simple moving average (4-hours). An immediate resistance on the upside is near the $28,000 level. There is also a key bearish trend line forming with resistance near $27,800 on the 4-hours chart of the BTC/USD pair.
The trend line is near the 50% Fib retracement level of the downward move from the $28,839 swing high to $26,525 low. The first major resistance is near the $28,000 level, above which the price could rise towards the $28,800 zone.
Any more gains might send the price towards the $30,000 zone. If there is no upside break, the price might start a downside correction below $27,000. The next key support is near the $26,500 level. Any more losses might call for a move towards the $25,500 support zone.
Looking at the chart, bitcoin price is clearly trading below $28,000 and the 55 simple moving average (4-hours). Overall, the price could continue to rise if there is a clear move above $28,000 level in the near term.
Technical Indicators
4 hours MACD – The MACD is now losing momentum in the bullish zone.
4 hours RSI (Relative Strength Index) – The RSI is now above the 50 level.
Key Support Levels – $27,000 and $26,500.
Key Resistance Levels – $28,000, $28,800 and $30,000.


Leave a Reply
You must be logged in to post a comment.