
- Bitcoin price started a fresh decline below the $40,000 level against the US Dollar.
- The price is now trading below $40,000 and the 55 simple moving average (4-hours).
- There is a key bearish trend line forming with resistance near $38,350 on the 4-hours chart of the BTC/USD pair (data feed from Coinbase).
- The pair must clear $38,350 and then $39,000 to start a decent recovery wave.
Bitcoin price declined heavily below $42,000 against the US Dollar. BTC even spiked below $37,000 and is currently correcting losses.
Bitcoin Price Analysis
Bitcoin price started a fresh decline from well above the $42,000 level. BTC declined below the $40,000 support zone to move into a bearish zone.
There was also a close below the $40,000 level and the 55 simple moving average (4-hours). The pair even declined below the $38,000 support level and traded as low as $36,350. It is now correcting losses and trading above the $37,000 level.
An immediate resistance is near the $38,380 level. It is near the 23.6% Fib retracement level of the recent decline from the $44,775 swing high to $36,350 low. The next major resistance on the upside is near the $38,500 level.
There is also a key bearish trend line forming with resistance near $38,350 on the 4-hours chart of the BTC/USD pair. To start another increase, the price must settle above the $39,000 level in the near term. The next major resistance could be $40,600 and the 55 simple moving average (4-hours).
The 50% Fib retracement level of the recent decline from the $44,775 swing high to $36,350 low is also near the $40,600 zone. If there is no upside break, the price might resume decline below $37,500.
The next key support is near the $37,000 level. If the price fails to stay above $37,000, it could extend losses in the near term. The main support sits near $36,350, below which there is a risk of a move towards the $32,000 level. Any more losses might call for a test of the key $30,000 support zone.
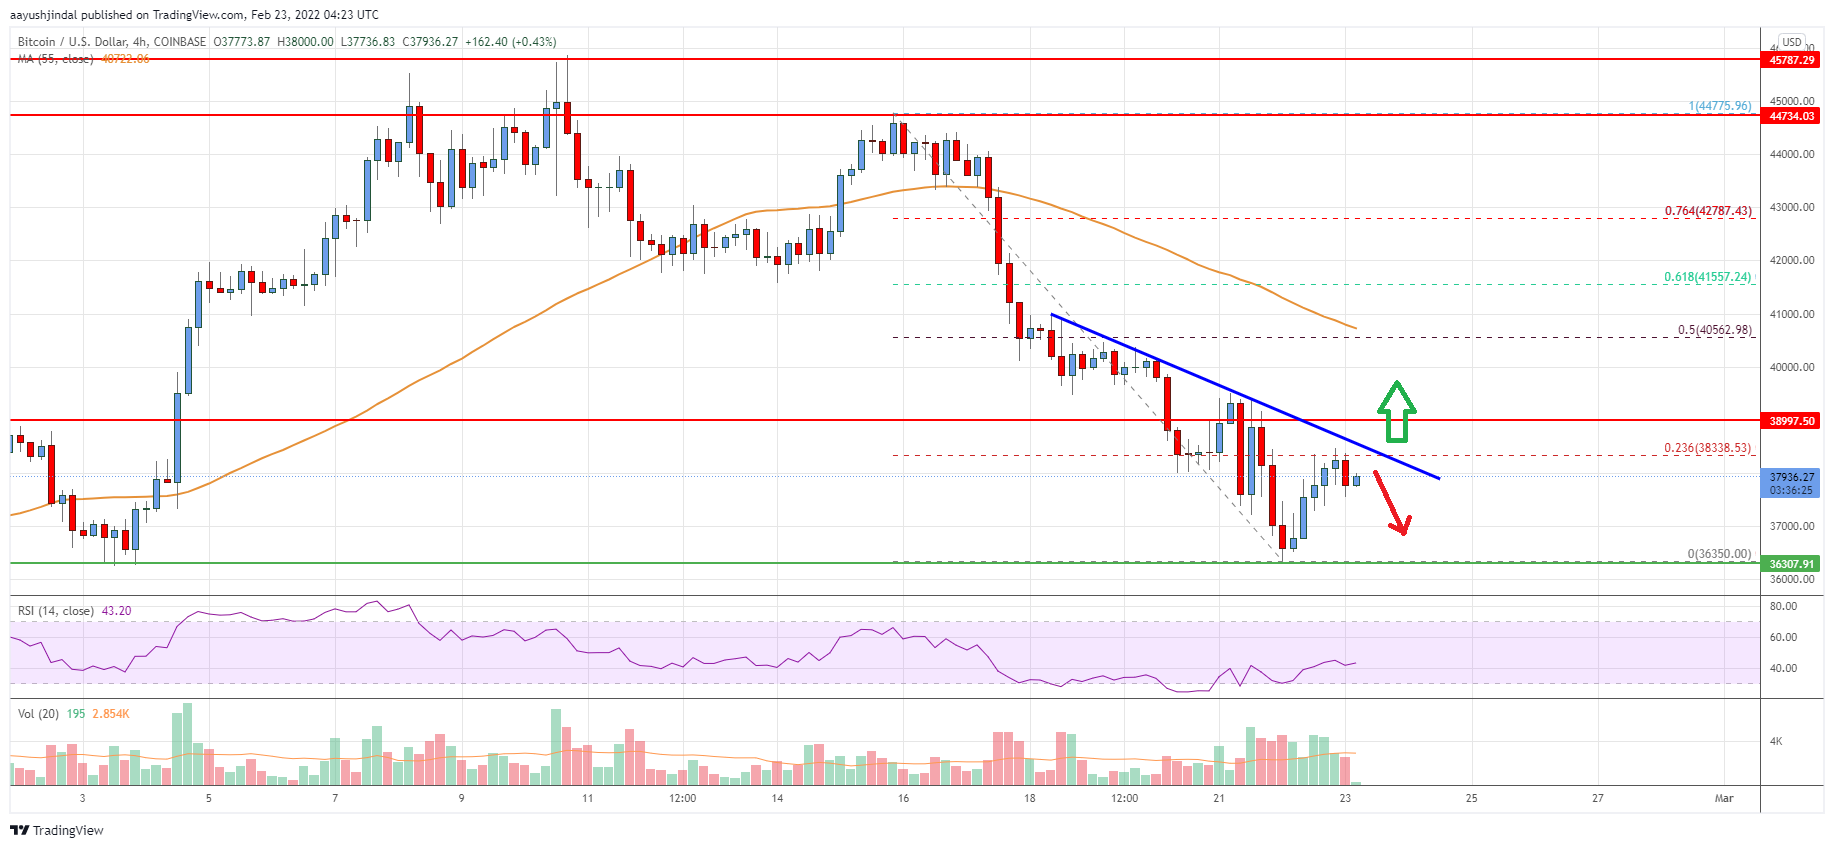
Looking at the chart, bitcoin price is clearly trading below $40,000 and the 55 simple moving average (4-hours). Overall, the price must clear $38,350 and then $39,000 to start a decent recovery wave.
Technical Indicators
4 hours MACD – The MACD is now losing momentum in the bullish zone.
4 hours RSI (Relative Strength Index) – The RSI is now just below the 50 level.
Key Support Levels – $37,000 and $36,350.
Key Resistance Levels – $38,350, $39,000 and $40,600.


Leave a Reply
You must be logged in to post a comment.