- Bitcoin price declined heavily and settled below the key $3,480 support level against the US Dollar.
- There is a crucial bearish trend line formed with resistance at $3,490 on the 4-hours chart of the BTC/USD pair (data feed from Coinbase).
- The price is likely to face a strong selling interest near the $3,480 and $3,490 resistance levels.
Bitcoin price moved into a bearish zone below $3,480 against the US Dollar. If BTC corrects higher, the previous supports near $3,480 may act as a strong hurdle for buyers.
Bitcoin Price Analysis
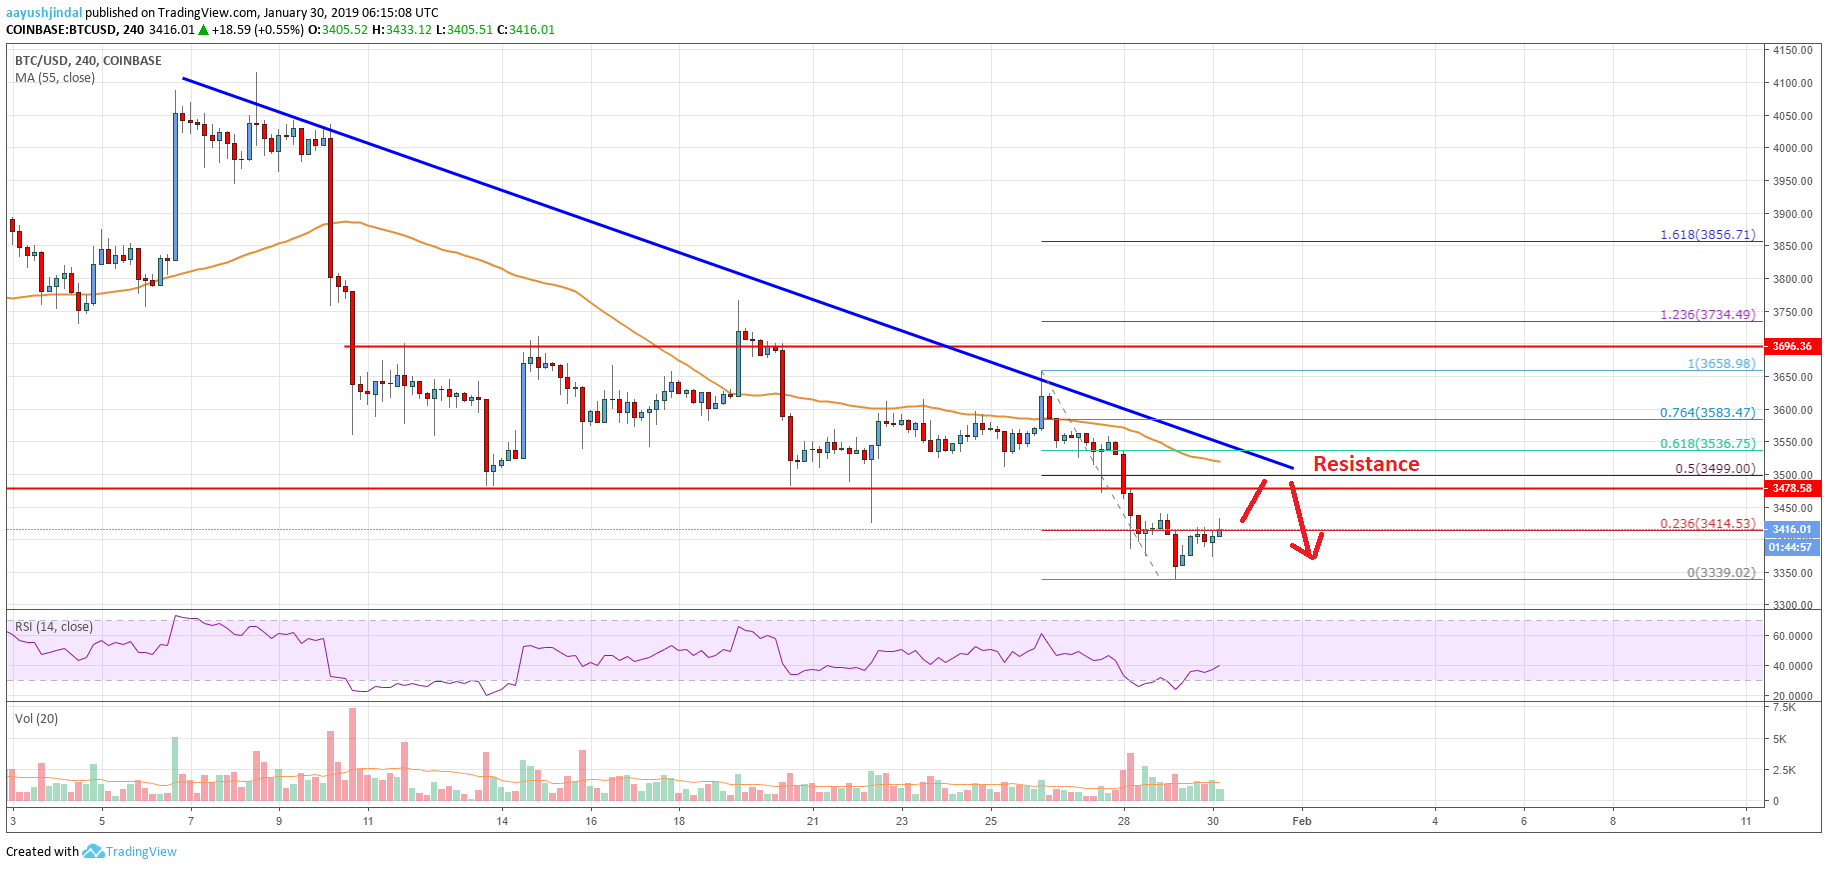
After a strong failure near the $3,650 level, bitcoin price started a major decline against the US Dollar. The BTC/USD pair declined heavily and broke the $3,540 and $3,480 support levels. There was also a close below the $3,480 support and the 55 simple moving average (4-hours). A new yearly low was formed at $3,339 and later the price started consolidating losses. It recovered above the $3,400 level and tested the 23.6% Fib retracement level of the last downside move from the $3,658 high to $3,339 low.
However, there are many hurdles on the upside near the $3,480 and $3,490 levels. There is also a crucial bearish trend line formed with resistance at $3,490 on the 4-hours chart of the BTC/USD pair. Moreover, the 50% Fib retracement level of the last downside move from the $3,658 high to $3,339 low is near the $3,499 level. Finally, the 55 simple moving average (4-hours) is placed just above the $3,500 level. Therefore, there is clearly a strong barrier formed near the $3,480 and $3,490 resistance levels. It seems like only a daily close above the $3,500 resistance could start a decent recovery. If not, there is a risk of a fresh decline below the $3,400 and $3,300 levels in the near term.

Looking at the chart, bitcoin price moved into a strong bearish zone below $3,480. Therefore, it may continue to move down towards the $3,300 or $3,200 support levels in the coming days.
Technical indicators
4-hour MACD – The MACD is showing a few positive signs and it may move into a positive zone.
4-hour RSI (Relative Strength Index) – The RSI is currently moving higher towards the 45 level.
Key Support Level – $3,300
Key Resistance Level – $3,500


Leave a Reply
You must be logged in to post a comment.