
JPMorgan Bitcoin Forecast: 10% Annual Return Tops Stocks and Gold

Latest in Bitcoin Price
JPMorgan Bitcoin Forecast: 10% Annual Return Tops Stocks and Gold
Bitcoin Price Prediction: $86K Breakout or Drop to $75.5K?
Bitcoin at $10,000? History Challenges Crash Fears as ETFs Lose $82M
Bitcoin Eyes $89,000 as Whales Add 16,010 BTC During the Dip
Bitcoin, Ethereum and XRP Flash Buy Signals After Major Sell-Off
The Bitcoin price has traded within a broad range since the beginning of the year, reflecting how quickly market conditions can change. While those swings often grab headlines, they are driven by a combination of economic trends, institutional demand, regulation, technical levels and investor sentiment. Understanding how these factors interact makes it easier to interpret Bitcoin price movements rather than reacting to every rally or pullback.
This guide explains the key drivers behind the Bitcoin price, reviews recent market behavior, explores the technical levels analysts watch, and shows how Bitcoin price forecasts are built and evaluated. Related: . It also covers the risks and limitations of forecasting, giving readers a clear overview of what is happening in the market and why it matters.
Bitcoin has hovered around $63,000 in recent weeks following months of crushing selling pressure. Price action has smoothed out compared to late 2025, although BTC is still trading well below its October 2025 peak. Current Bitcoin price action signals a time of consolidation as buyers and sellers compete for control.
The OG coin traded at $63,129 at the latest update. Market capitalization stood at $1.27 trillion, keeping Bitcoin as the largest cryptocurrency by market value. Also covered: Elon musk backs bitcoin value while rejecting crypto promotion and. Daily trading volume reached $15.7 billion, up 30.46% over the previous 24 hours. Trading activity picked up, even as price remained close to recent levels.
Market signals remain mixed. Bitcoin has recorded 15 green days during the past 30 sessions, meaning half of those days closed above their opening price. Even so, BTC continues to trade below its 200-day simple moving average, suggesting that longer-term momentum is weak.
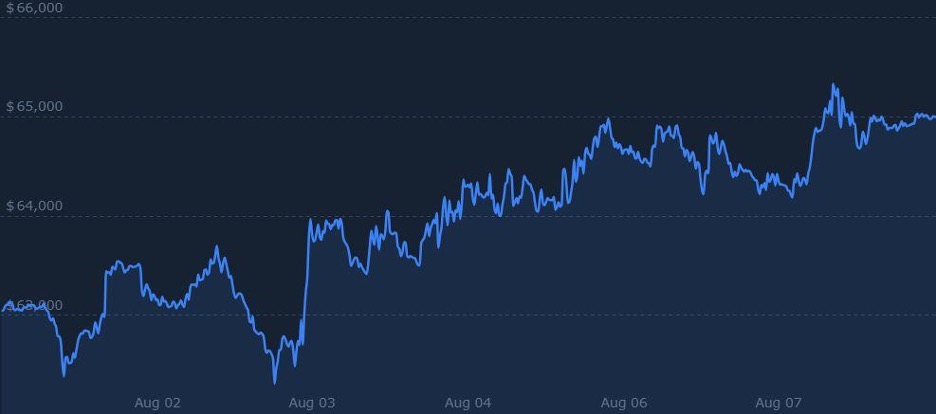
Bitcoin has traded at 52-week highs of roughly $126,200 before diving into a lengthy correction. During the same period, the price fell to a 52-week low near $57,750. Trading at roughly $63,129, Bitcoin now sits in the lower half of its yearly high-low range. Although it has found some support above its annual low, BTC is still well below highs reached in the 2025 rally.
Bitcoin spent much of mid-2025 trading between $115,000 and $118,000, although brief rallies pushed it above that range before momentum tapered off. Selling pressure spiked during the second half of this year, dropping BTC below $100,000 prior to a steep decline in early 2026.
The Bitcoin price later traded between roughly $58,000 and $76,000, producing multiple attempts to recover without reclaiming previous highs. Recent price action has since coiled around the low-$60k range. Bitcoin remains about 44% below its level from a year ago, illustrating the size of the correction.
Bitcoin’s price is determined by its supply and demand, but those forces extend far beyond crypto markets. Global liquidity, investor sentiment, institutional participation, and Bitcoin’s own network activity all influence price movements. Understanding what factors influence the BTC price helps investors interpret Bitcoin rallies, stalls, or falls after major news events.
BTC is often treated as a macro-risk asset, meaning that interest rates and global liquidity count as much as crypto-native order flow. Furthermore, the profile of long-term holders and realized-profit metrics help identify whether selling comes from experienced investors or short-term traders using leverage. Spot Bitcoin ETF creations and redemptions also act as an on-demand demand channel that can influence price without changing Bitcoin’s on-chain supply dynamics.
No single indicator explains every market move. Also covered: . Instead, the combination of macroeconomic conditions, institutional demand, regulatory developments, and on-chain activity gives investors a clearer picture of what may have contributed to price movements.
Bitcoin behaves like a macro-risk asset rather than a standalone digital currency. Its short-term price movements have the same drivers as equity markets. Much of Bitcoin’s price performance has been linked to central banks adding liquidity to the economy or signaling lower borrowing costs. As such, investors are more inclined to take on risk, which has helped Bitcoin do well with stocks and other growth assets.
On the other hand, tighter monetary policy usually has the opposite effect by reducing liquidity and weakening demand for riskier investments. The strength of the U.S. dollar also plays an important role. A strong U.S. dollar tends to divert investment away from riskier assets. Conversely, a weak dollar typically stimulates investment in risk assets such as Bitcoin and other non-traditional assets.
Bitcoin’s relationship with traditional financial markets is fluid, evolving over time and across asset classes. That said, Bitcoin now tends to move with traditional financial markets such as the S&P 500 and Nasdaq when influenced by macroeconomic news. For example, inflation reports, the Fed and liquidity conditions have all influenced investor sentiment, typically causing risk assets to move in tandem with Bitcoin.
Recent market cycles make it clear how liquidity conditions affect the Bitcoin price. During 2020 and 2021, central banks lowered rates to near zero and pumped trillions of dollars into the global financial system. This wave of liquidity had a spill-over effect on risk assets, including Bitcoin. The asset rallied from under $ 10,000 in mid-2020 to almost $69,000 in November 2021.
In 2022, persistently high inflation prompted the U.S. Federal Reserve to raise rates aggressively from near zero to over 5%. This dried-up liquidity drove borrowing costs higher and forced the market to sell risky assets. Bitcoin fell from its late 2021 high to under $16,000 in December 2022.
Conditions improved again in 2023 and 2024 as inflation began to ease and the Federal Reserve paused its rate hikes. Markets started pricing in future rate cuts, raising expectations that financial conditions would become more supportive. At the same time, the launch of spot Bitcoin ETFs attracted institutional demand that helped boost Bitcoin’s rally in 2024.
Bitcoin ETFs have made the OG asset more accessible to both institutional and retail investors. Investors can now gain exposure through regulated brokerage accounts rather than buying and storing crypto directly. They no longer need to manage private keys, and institutions such as pension funds, asset managers and others with strict investment requirements can invest more easily.
ETF flows have become one of the clearest markers of institutional demand, as they can directly affect the conventional spot market. When investors “put in” money in spot Bitcoin ETFs, authorized participants buy real BTC from exchanges to create new ETF shares. On the other hand, when investors “pull out” money, Bitcoin is sold to redeem those shares. Unlike other indicators that just reflect sentiment, ETF flows create real buying and selling pressure.
This dynamic has become even more important since the 2024 halving slowed the flow of new Bitcoin into the market. U.S. spot Bitcoin ETFs absorbed 19,000 BTC over a nine-day streak in April 2026, while miners brought on just 2,100 BTC. Institutional investors were buying Bitcoin nearly nine times faster than new coins were being mined most of the time, so a relatively small increase in demand could still affect prices.
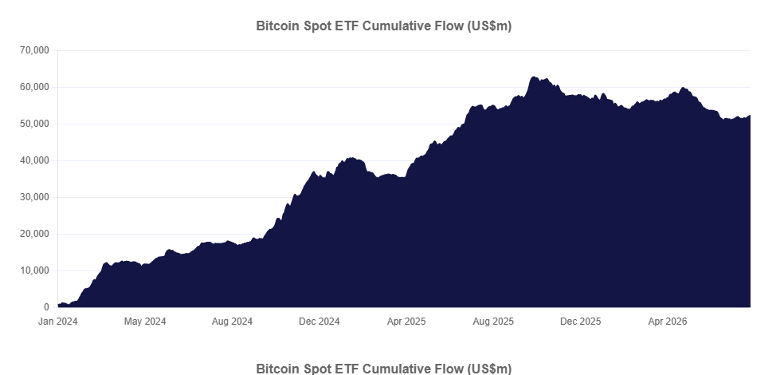
The imbalance becomes even clearer over longer periods. Following the post-halving reduction in block rewards to 3.125 BTC, the Bitcoin network now produces roughly 13,500 BTC each month. In April 2026, purchases by spot Bitcoin ETFs and Strategy captured the equivalent of six to seven months of new miner supply.
Although Bitcoin’s price still depends on overall market sentiment, the supply-demand imbalance has become increasingly important. As a result, sustained institutional buying can have a much larger impact on prices than in previous cycles.
Recent ETF data further highlights this growing influence. U.S. spot Bitcoin ETFs recorded $2.44 billion in net inflows during April 2026, the strongest monthly total of the year. By May, these funds managed more than $102 billion in assets and held approximately 1.3 million BTC. This represents about 6% to 7% of Bitcoin’s circulating supply. As more Bitcoin moves into long-term institutional holdings, fewer coins remain readily available on exchanges, making the market more sensitive to changes in demand.
In recent years, regulation has become one of the key drivers of the Bitcoin price. Clear rules encourage investor confidence and capital flow, whereas regulatory uncertainty often triggers caution and volatility.
Clearer digital asset regulations have encouraged greater institutional participation in many countries by introducing licensing requirements, stricter custody standards and stronger investor protection measures. As a result, regulated banks and custodians in a growing number of jurisdictions now offer Bitcoin-related services, giving institutional investors greater confidence to enter the market.
Regulation is also evolving in some ways that affect retail crypto users. Exchanges are exposed to new duties and obligations under anti-money laundering (AML) rules and reporting requirements. Although this lowers operational risk for larger financial institutions, it makes it a bit more difficult for retail crypto users to navigate.
Market sentiment tends to follow the policy developments. Investors react more positively to changes in the political environment, as it allows them to clearly assess the value of risk. Furthermore, market participants are more likely to continue investing and trust that capital will keep flowing into the market.
If there’s uncertainty, delayed decisions or proposed restrictions, it could have a negative effect on sentiment. Deteriorating sentiment can reduce investors’ confidence that capital will continue to flow into riskier assets and heighten volatility.
A recent example of regulatory policy affecting market sentiment comes from the U.S. Securities and Exchange Commission (SEC). The commission approved generic listing standards for spot crypto exchange-traded products (ETPs) in September of 2025. This replaced a case-by-case approval process and shortens the approval process to 75 days or less.
Significantly, the action improved confidence that a supportive regulatory environment would exist and encouraged issuers to speed their share offerings. In turn, this helped to increase trading activity and greatly benefited Bitcoin market sentiment.
On-chain metrics provide insight into activity taking place on Bitcoin’s blockchain, allowing investors to better understand market behavior beyond price action. Whether investors are buying, selling or holding and to what extent can be assessed by following on-chain metrics. Several metrics provide a better understanding than price data alone can.
Despite being stunted by short-term price swings, Bitcoin’s on-chain data continues to point to healthy long-term network activity. Investors can use metrics such as hash rate, long-term holder supply, exchange balances and Bitcoin’s fixed supply schedule to assess network activity. These indicators help reveal whether market conditions favor a bullish or bearish outlook.
Meanwhile, network security remains one of Bitcoin’s strongest fundamentals. Following several declines in mid-July, the network’s hash rate has recovered and is hovering near record levels. This means miners would still invest despite short-term market turbulence. A higher hash rate strengthens Bitcoin’s security and signals confidence among miners.
The growing long-term Bitcoin balances provide another signal of bullish conviction. According to recent on-chain data, long-term holders currently own the highest balance on record, approximately 16 million BTC. The logic is that these holders will sell only rarely, particularly during times of risk.
Historically, long-term holders’ balances typically increase during the early and middle phases of a bull cycle, then fall before market tops. On the other hand, exchange balances have dropped sharply, suggesting a rational shift away from the cryptocurrency over the past year.
Bitcoin balances held on centralized exchanges fell from around 2.9 million BTC to 2.71 million BTC, the lowest on record. Investors are now actively moving their Bitcoin into cold storage as well as into institutional custody and other long-term wallets. This, combined with the other bullish signals, suggests that the Bitcoin price will continue to rally if crypto demand remains strong.
Bitcoin’s emission schedule gives us another big clue about Bitcoin price. Its total supply is permanently capped at 21 million coins, and new issuance is reduced every 210,000 blocks through the halving process. After the 2024 halving, miners will receive 3.125 BTC per block, slowing the rate at which new Bitcoin enters circulation.
Bitcoin has historically moved through recurring market cycles, with each halving playing a key role in shaping long-term price trends. Every four years, these “block reward halvings” reduce the rate at which new Bitcoin enters circulation, tightening the supply curve over the long term. Lower issuance has tightened supply over time, particularly when demand continues to grow.
For every Bitcoin halving, the most significant price gains have occurred approximately 12 to 18 months after the event. Bitcoin has consistently reached new all-time highs during the post-halving period before entering a broader market correction.
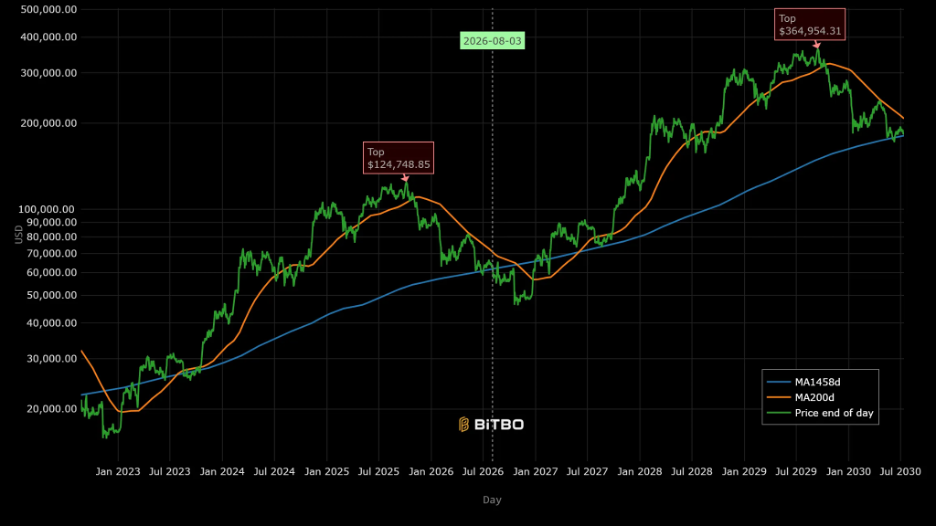
However, this is not a guarantee that subsequent cycles will repeat the pattern. The most recent halving in April 2024 reduced the block reward from 6.25 BTC to 3.125 BTC, slowing Bitcoin’s annual supply growth to its lowest level on record.
Moreover, current market conditions are different from previous cycles. The launch of spot Bitcoin ETFs, increased institutional demand, and new corporate treasury purchases are bringing new demand to the market. These sources of demand were largely absent during previous bull runs. At the same time, fewer newly mined coins are entering circulation, forcing buyers to compete for a smaller supply.
Forced liquidations and leverage flushes can make BTC moves much sharper than spot market flows alone would suggest. When too many traders are positioned with leverage, a sudden price move can trigger liquidations and create even more buying or selling pressure.
Open interest and funding rates offer a clearer view of how much leverage is sitting in the market and whether traders are heavily positioned in one direction. Together, these metrics help explain why a move may accelerate once it starts. They are best used to understand broader market structure and positioning rather than treated as signals for predicting what happens on a single candle.
Venue access matters as much as the indicator print. In September 2026, Singapore Exchange obtained CFTC authorization under Regulation 48.10 so eligible U.S. institutions can access SGX bitcoin and ether perpetual futures through clearing members, without SGX registering as a separate U.S. exchange. Authorization is market-structure news. It is not a spot ETF creation, and it is not the same as trading already live on day one of the order. Onboarding through U.S. clearing members still has to finish before desks can treat those contracts as a working venue. Keep that foreign-board path separate from CME dated futures, offshore crypto-native perps, and spot ETF flow headlines when reading the same week’s derivatives tape.
BTC often behaves like a macro-risk asset, so factors such as interest rates, liquidity conditions, and broader market sentiment can influence price alongside crypto-native flows. Looking at long-term holder distribution and realized-profit metrics can also provide more context around selling pressure. These indicators help show whether older holders are taking profits or whether short-term traders and leveraged positions are driving the move.
Spot Bitcoin ETF inflows and outflows add another important layer. Strong ETF creations can bring fresh demand into the market, while redemptions can create additional selling pressure. Unlike on-chain transfers, however, ETF activity does not change Bitcoin’s underlying supply rules. Instead, it provides a visible channel through which traditional market demand can influence price.
Political calendar shocks, including a U.S. shutdown tape, can print new highs without changing the same drivers: leverage, holder behavior, and ETF access demand.
Bitcoin price levels help traders and investors identify areas where there may be increased buying or selling pressure. Some levels are support, where demand slows or stops the price decline. Some levels are resistance, where selling pressure can impede further gains. By watching these zones, market players can better evaluate the next possible market move and make better-informed choices about buying or selling Bitcoin for short or long term.
Short-term traders use these levels to set entry and exit points, stop-loss orders, and profit targets. On the other hand, long-term Bitcoin investors use them differently. Major support and resistance zones help them assess whether the broader trend remains strong, identify potential accumulation areas, and determine when it may be time to take profits.
Experienced traders combine a range of tools to identify price zones with multiple sources of signals pointing to the same possible conclusion. Related: Bitcoin price analysis goldman sachs sees possible btc bottom. The more evidence supporting a price zone, the more significant it becomes. Knowing how these levels are derived and why they could be significant for market action can help an investor avoid overreacting to every turn in price action.
Support is a price area where buying interest is sufficient to slow or even stop a decline. As the Bitcoin price nears support, demand can often rise to or even exceed selling pressure. Such conditions increase the chance of a bounce.
Resistance is the opposite of support. It is a price area where selling pressure is more likely to emerge and intensify as prices move higher. Traders often take profits as prices approach resistance, while others expect a reversal when prices fail to move above it.
Both support and resistance are concepts that do not guarantee a change in direction. Strong buying can push Bitcoin above resistance, while heavy selling can push it below support. For this reason, many traders wait for confirmation, such as higher trading volume or a strong candle close, before acting on a breakout or breakdown.
Finding important Bitcoin price levels involves more than looking at a single chart or indicator. When different indicators point to the same price zone, that level usually becomes more significant because more market participants are watching it.
Rather than relying on one signal, traders generally look for four broad types of price levels: historical levels, technical indicators, psychological levels, and volume-based levels. Each provides a different perspective on where Bitcoin’s price could react next. See also: Wikipedia co founder predicts bitcoin price could drop below 10k.
In most cases, previous highs and lows indicate potential support and resistance levels for Bitcoin. These price levels are where the price has changed direction and are often highlighted by technical traders because they are useful in predicting potential price moves.
If the price has struggled several times to move above the same level, that area often becomes resistance. Likewise, repeated rebounds from a similar price create a support zone. Recent daily highs and lows can also act as resistance, as the price will test these levels a few times before moving above them. All-time highs and all-time lows are among the most-watched levels by Bitcoin traders because they are the least-touched price levels in Bitcoin’s history.
Moving averages help traders identify price levels that change as the market moves. Commonly used averages, including the 50-, 100-, and 200-day moving averages, often act as support during an uptrend and resistance during a downtrend.
Trend lines and trend channels also help map the market’s direction by connecting a series of higher lows or lower highs. At the same time, Fibonacci retracement levels highlight areas where Bitcoin may pause or reverse after a strong move, making them popular tools for identifying potential pullback zones.
Traders tend to pay more attention to round numbers because they are easier to remember. Prices such as $50,000, $75,000, and $100,000 often become important trading zones where many investors set buy orders, sell orders, stop-loss orders, and profit targets. Consequently, a lot can accumulate at those levels, increasing the chances of strong price reactions when Bitcoin reaches or exceeds them.
Trading volume provides another layer of confirmation. Areas where large amounts of Bitcoin were previously traded often attract buyers and sellers again, making them important support or resistance levels. Many traders also use pivot points, which are calculated from the high, low, and closing price of the previous period in trading, to estimate near-term support and resistance levels.
The strongest price levels usually appear when multiple indicators point to the same area. This is known as confluence. For example, Bitcoin may approach a previous swing high that aligns with the 200-day moving average. That same area could also align with a Fibonacci retracement level or a major psychological price, such as $100,000.
When several indicators converge, that price level tends to attract more market attention and often triggers a stronger market reaction. However, it is no guarantee of a breakout or reversal, but it can be an important way to identify the price areas that merit close scrutiny before making trading decisions.
Both traders and long-term investors use price levels to make informed decisions, but for very different reasons. Short-term traders look at price support and resistance to decide where to enter and exit, and to set stop-loss and take-profit levels. They also watch trading volume near these levels to confirm a breakout or breakdown.
Meanwhile, long-term traders are less concerned about short-term price swings, so holding above important support indicates a healthy long-term structure. These levels can also help investors identify potential accumulation zones during market corrections or areas where taking profits may be worth considering.
| Level Type | How It’s Identified | Significance |
| Psychological Levels | Round numbers such as $50,000, $75,000, or $100,000 where traders commonly place buy orders, sell orders, stop-losses, and take-profit orders. | Often attract heavy trading activity because many market participants watch the same prices. Breaks above or below these levels can trigger fear of missing out, panic selling, or rapid liquidation events. |
| Support Levels | Previous price floors where buying pressure repeatedly stopped a decline. | Suggest buyers are willing to defend a price zone. Holding support often keeps the broader trend intact, while losing it can lead to further declines. |
| Resistance Levels | Previous price ceilings where selling pressure repeatedly stopped an advance. | Can slow rallies as traders take profits or open new positions. A confirmed breakout above resistance may signal stronger bullish momentum. |
| Moving Averages | Dynamic levels calculated from average prices over periods such as 50, 100, or 200 days. | Frequently act as changing support or resistance and are widely monitored by both institutional and retail traders. |
| Historical Highs and Lows | Previous swing highs, swing lows, all-time highs, and all-time lows. | Mark areas where supply and demand shifted in the past. Repeated price reactions strengthen their importance. |
| Fibonacci Retracement Levels | Percentage-based retracement levels drawn between significant highs and lows. | Help identify potential pullback zones where buyers or sellers may return before the prevailing trend resumes. |
| Trend Lines and Channels | Lines connecting higher lows or lower highs to map the market’s direction. | Create dynamic support and resistance that evolve with price movement. Repeated touches increase their reliability. |
| Volume-Based Levels | Areas where unusually high trading volume occurred. | Heavy trading activity often creates important price zones where buyers and sellers become active again. |
| Pivot Points | Mathematical levels calculated from the previous session’s high, low, and close. | Commonly used by short-term traders to estimate intraday support and resistance levels. |
Bitcoin price predictions are not based on guessing what a market might do next. See also: Veteran bitcoin trader warns next btc price bottom may hit. To understand the forces moving the market, professional analysts combine a variety of analytical methods to generate a range of possible outcomes. No single indicator can predict Bitcoin’s value with certainty, but the most reliable data can narrow down a range of likely outcomes.
Professional analysts create many scenarios, updating their forecasts with each market shift and new data point. The framework below illustrates how many analysts approach Bitcoin forecasting when working with the data available.
Although every analyst has their own process, most forecasts follow a similar sequence. Each step builds on the previous one, creating a more balanced view of where Bitcoin could move next.
The first step is to understand the overall financial environment. Many analysts will first assess whether the macro environment is bullish, neutral or bearish before looking at BTC itself.
For example, lower rates and improving liquidity tend to encourage investors to allocate more capital to growth-oriented assets such as Bitcoin. In contrast, higher rates and tighter policy crowd out liquidity and push up demand for safe assets.
Once the macro backdrop is understood, analysts evaluate demand. One of the clearest demand indicators is spot Bitcoin ETF activity. Consistent ETF inflows suggest institutional players are taking on more exposure, while sustained outflows may signal demand is faltering.
There are other ways to measure demand through corporate treasury purchases, institutional buying and market activity. Demand on its own is a weak indicator of price, but it becomes much more meaningful when it aligns with favorable macro conditions.
The next phase is to examine what happens on the Bitcoin blockchain. Many analysts look at metrics such as long-term holder supply, exchange balances or network hash rate. If long-term holder balances grow as exchange balances shrink, it may indicate that investors are opting to store Bitcoin rather than sell.
Interestingly, a boost in hash rate simultaneously indicates continued investment in network security despite short-term market volatility. This kind of data is useful in assessing whether the network is in step with the overall market narrative.
Analysts usually identify major support and resistance zones using previous highs and lows, moving averages, trend lines and Fibonacci retracement levels. Psychological price levels, such as $75,000 or $100,000, can also be factors, as buying and selling usually intensifies at these levels.
Strong levels are often found where several indicators converge at the same price point. This often warrants more attention from traders, as there is a higher chance that buyers or sellers may step in at such levels. Technical levels are not a forecast of what will happen, but rather an attempt to estimate where buying or selling may be most likely to come in.
Instead of relying on a single indicator, analysts compare all the information gathered during the previous steps.
For example, imagine the following conditions:
Individually, none of these signals supports a rally. However, they provide a stronger case for a bullish scenario than any single indicator could on its own. Similarly, the case for a downtrend can be strengthened by weak liquidity, FTC outflows, expanding exchange balances and a breach of major support. When forming conclusions, it is generally better to seek consensus across multiple indicators rather than relying on any single data point.
Bitcoin forecasts also vary depending on the time horizon. Short-term forecasts, which typically cover weeks to several months, rely heavily on technical analysis, market sentiment, ETF flows, macroeconomic news, and trading activity. Because these factors change quickly, short-term forecasts often require frequent updates.
Long-term forecasts, covering several years, focus more on adoption trends, institutional participation, regulation, Bitcoin’s fixed supply, and broader economic assumptions. Rather than predicting day-to-day price movements, these forecasts estimate how Bitcoin’s value could evolve as the network matures.
The further a forecast extends into the future, the more it depends on assumptions that may change over time. As a result, long-term projections should be viewed as possible scenarios rather than precise predictions.
It is impossible to predict Bitcoin’s future price with certainty, which is why experienced investors rely on multiple scenarios to assess potential market outcomes. A scenario-based approach helps explain how Bitcoin is likely to be affected by changing market conditions and makes it easy to adjust expectations in light of new information.
The three scenarios below are derived from the drivers discussed earlier, including macro, ETF flows, regulation, on-chain activity and technicals.
A bullish outlook becomes more likely when several positive signals appear at the same time. Improving global liquidity, lower interest rates, strong spot Bitcoin ETF inflows, supportive regulation, and continued institutional adoption can all strengthen demand. Further reading: Bitcoin ogs selling covered calls are quietly capping btcs upside. On-chain data may also support this view if long-term holders continue accumulating Bitcoin while exchange balances keep falling.
If these conditions develop together, Bitcoin could break above major resistance levels and attract additional buying interest. A confirmed breakout may improve market sentiment and increase the chances of revisiting previous highs before pushing into new price territory.
The base case assumes market conditions remain mixed. Institutional adoption continues at a steady pace, ETF demand stays healthy without accelerating sharply, and macroeconomic conditions neither strongly support nor significantly weaken the market.
Under these conditions, Bitcoin is more likely to trade within a broad range while gradually forming higher lows over time. Short-term volatility would remain, but price movements would be driven by changing economic data, investor sentiment, and developments across the crypto market rather than a single major catalyst.
A bearish outcome becomes more likely if financial conditions tighten, liquidity declines, or investor confidence weakens. Persistent ETF outflows, stricter regulation, slowing adoption, or signs of distribution from long-term holders could all increase selling pressure.
If Bitcoin fails to hold important support levels under these conditions, the market could enter a longer period of consolidation or move into lower trading ranges. Even then, short-term rallies may still occur, but broader market conditions would continue to favor caution until stronger signs of recovery emerge.
Bitcoin’s price history has often moved alongside the network’s predetermined supply schedule, particularly the halving events that reduce new coin issuance every four years. Since Bitcoin operates under a fixed monetary policy, each halving slows the rate of new supply entering circulation while the total supply remains capped at 21 million coins. Past cycles suggest those supply reductions have frequently preceded strong market rallies, making halvings one of the most closely watched events in the crypto market.
Still, the relationship is not as straightforward as it once appeared. Bitcoin has grown from a niche digital asset into a global financial market with institutional investors, spot ETFs, corporate treasury holdings, and broader macroeconomic influences. Interest rates, liquidity conditions, regulation, and investor sentiment now play a much larger role in price discovery. As a result, previous cycles provide valuable context but cannot confirm how the current market will unfold.
Looking at Bitcoin’s historical price action alongside major network events helps explain how the market has responded to changes in supply over time. It also shows why each cycle has developed differently despite sharing similar structural patterns. The sections below examine those historical trends, recurring market phases, and the factors that could make the current cycle unlike any before it.
Bitcoin’s four-year halving cycle has become one of the most recognizable patterns in its price history. Also covered: New bitcoin study says 4 year halving cycle is fundamental. Unlike traditional assets, Bitcoin follows a predetermined monetary policy written into its code. Every 210,000 blocks, or roughly every four years, the reward miners receive for validating transactions is cut in half. That schedule continues until Bitcoin reaches its maximum supply of 21 million coins.
Each halving reduces the number of new Bitcoins entering circulation. For example, the reward fell from 50 BTC per block in 2009 to 25 BTC in 2012, then to 12.5 BTC in 2016, 6.25 BTC in 2020, and 3.125 BTC after the 2024 halving. Lower issuance slows Bitcoin’s inflation rate, making new supply increasingly scarce over time.
Past market cycles show a recurring relationship between these supply reductions and Bitcoin’s long-term price performance. Although prices rarely surge immediately after a halving, each event has been followed by a strong bull market over the following 12 to 18 months. Related: Bitcoin price prediction bitmex co founder arthur hayes forecasts 250000. Many analysts attribute part of that trend to tightening supply, especially when demand remains steady or continues to grow.
| Halving Year | Bitcoin Price Near Halving | Next All-Time High | Approximate Gain |
| 2012 | $12 | $1,150 | +9,000% |
| 2016 | $650 | $19,800 | +2,900% |
| 2020 | $8,600 | $68,700 | +700% |
| 2024 | ~$63,000 | Current cycle ongoing | Pending |
Historical data also reveals another trend. Returns have gradually declined with each cycle. Bitcoin’s growing market capitalization means substantially more capital is now required to produce the same percentage gains seen during its early years. Even so, previous cycles show that strong appreciation has remained possible after each halving despite lower relative returns.
Investors should also remember that markets rarely wait for the halving itself. Expectations often begin shaping prices months before the event as traders position for reduced supply. By the time a halving occurs, part of its expected impact may already be reflected in the market.
Although the connection between halvings and price cycles has remained consistent throughout Bitcoin’s history, supply is only one piece of the equation. Institutional demand, exchange-traded fund inflows, macroeconomic conditions, monetary policy, and investor sentiment all influence how each cycle develops. For that reason, halvings should be viewed as one structural driver rather than a guarantee of future price gains.
Bitcoin’s price has always gone through repeated cycles of growth, correction, consolidation and recovery. While each period came under different economic and market conditions, several long-term trends have been consistent.
Every major bull market has started after a Bitcoin halving, though prices have not risen immediately after the event. See also: Bitcoin price bitcoin eyes 112k breakout after forming ascending triangle. Each halving reduces the number of new Bitcoins entering circulation, gradually tightening supply. When demand remains steady or increases, that lower supply can support higher prices over time.
Previous cycles had a comparable uptick after the halving. The 2012 halving sent Bitcoin above $1,000, followed by a climb toward $20,000 after the halving in 2016, and a surge near $69,000 after the 2020 halving. The current cycle is repeating after the 2024 halving but is still underway.
Still, a halving is not enough to prompt a bull market. Investors anticipate the halving months in advance, and that anticipatory price is often already baked in before the block reward drops.
Every major rally has eventually been followed by a sharp correction. As prices climb and optimism grows, investors start taking profits, which leads to heavy selling. Bitcoin dropped more than 80% of its value after the 2013 peak before finding support.
A similar decline followed the 2017 bull market, leading to the extended bear market in 2018. Another major correction came in 2022 after Bitcoin hit its previous all-time high at the end of 2021.
Despite these steep declines, each bear cycle ended with Bitcoin holding above the lows of the previous cycle. Rather than ending its long-term trend, these corrections have repeatedly reset market sentiment before another period of growth began.
One of the strongest patterns in Bitcoin’s price history is its ability to record higher highs and higher lows over time. In other words, every bull market has chased new highs beyond the previous one, while each market correction and bear market cycle has closed above the previous major low.
Bitcoin moved from about $32 in 2011 to roughly $1,240 in 2013. In 2017. The asset moved from nearly $19,800 to about $68,800 in 2021 and up to $120,000 during the current price cycle. At the same time, each market correction moved Bitcoin to a higher price floor than the last low, which can be seen as the result of wider adoption and growing investor participation. While volatility remains high in the short term, this long-trended pattern has persisted throughout Bitcoin’s history.
Bitcoin’s market cycles generally move through four distinct phases, though the timing and length of each stage can vary. The accumulation phase begins after a major decline. Prices stabilize while market interest remains low, giving long-term investors an opportunity to gradually build positions. Further reading: Bitcoin price struggles below 92k but remains bullish in the.
Next comes the mark-up phase. Demand begins to increase, prices move higher, and positive sentiment returns. As momentum builds, more investors enter the market. The distribution phase usually appears near the market peak. Early investors begin taking profits while retail participation and media attention reach their highest levels.
Finally, the markdown phase marks the start of the bear market. Selling pressure increases, prices fall sharply, and market sentiment turns negative. Over time, prices stabilize, setting the stage for another accumulation phase and the beginning of a new cycle.
These phases offer a useful way to understand Bitcoin’s long-term price behavior. Even so, no two cycles are identical. Market conditions, investor participation, and unexpected events can change both the pace and the strength of each phase.
Bitcoin’s historical market cycles provide useful insight into how the asset has behaved over time, but they should not be treated as a blueprint for future performance. Each cycle has developed under different market conditions, adoption levels, and economic environments. Although recurring patterns such as post-halving rallies and major corrections have appeared several times, past performance does not guarantee similar results in the future.
As Bitcoin continues to mature, several factors make it harder to rely solely on historical cycles when assessing where the market could move next.
Bitcoin today is very different from the asset that traded through its early market cycles. Earlier bull markets were driven largely by retail investors, lower trading volumes, and limited market infrastructure. Smaller amounts of capital could move prices sharply, leading to large swings in both directions.
Today’s market is far more developed. Spot Bitcoin ETFs, institutional investors, corporate treasury holdings, regulated custodians, and a larger derivatives market have changed how Bitcoin is bought, sold, and held. Greater liquidity has helped moderate price swings, while institutional investors often follow longer investment horizons than retail traders. These changes suggest future cycles may not produce the same gains or corrections seen during Bitcoin’s early years.
Bitcoin has never completed two market cycles under the same global economic backdrop. Each period has been shaped by different combinations of monetary policy, inflation, liquidity, regulation, and geopolitical events.
| Period | Major Triggering Event | General Market Behavior |
| 2012–2013 | First Bitcoin halving and growing retail awareness | Strong bull market driven by early adoption and speculation. |
| 2016–2017 | Second halving and ICO expansion | Rapid price growth fueled by retail participation. |
| 2020–2021 | Third halving, pandemic stimulus, institutional adoption | Bitcoin reached new highs as liquidity increased and institutions entered the market. |
| 2022 | Aggressive interest-rate hikes, inflation concerns, major crypto failures | Extended bear market with weaker liquidity and lower risk appetite. |
| 2024–Present | Fourth halving, spot Bitcoin ETFs, improving regulatory clarity | Current cycle supported by institutional demand, though macro conditions continue to influence price action. |
These differences show that broader economic conditions can either strengthen or weaken Bitcoin’s natural market cycle. A period of abundant liquidity may support higher prices, while tighter financial conditions can slow market growth even after a halving.
Another limitation is the small amount of historical data available. Since Bitcoin launched in 2009, it has completed only four halving cycles and experienced a limited number of major bull and bear markets.
From a statistical standpoint, that is a relatively small sample. Many widely discussed patterns, including the four-year cycle and post-halving rallies, are based on only a handful of observations. While those trends have remained consistent so far, there is no certainty they will continue as the market develops.
Each halving still reduces the number of new Bitcoins entering circulation, but its effect on supply becomes smaller as Bitcoin’s total circulating supply grows.
During Bitcoin’s early years, halvings removed a large share of new supply from the market. Today, Bitcoin’s inflation rate is already very low, so each successive halving has a smaller effect on overall issuance.
Demand-side factors may now carry greater weight than supply reductions alone. ETF inflows, institutional investment, regulatory decisions, and global liquidity could have a larger influence on price than miner issuance in future cycles.
Historical cycles also cannot account for unexpected events that reshape market conditions. Regulatory changes, central bank policy, recessions, exchange failures, cybersecurity incidents, geopolitical conflicts, or rapid institutional adoption can all influence Bitcoin’s price regardless of where it appears to be within a historical cycle.
Recent history offers several examples. Pandemic-era stimulus supported one of Bitcoin’s strongest bull markets, while aggressive interest-rate hikes and major crypto company failures contributed to the deep bear market in 2022. More recently, spot Bitcoin ETFs introduced a new source of institutional demand that was absent during previous cycles.
Bitcoin’s historical price cycles remain valuable because they show how the market has responded to changes in supply, investor sentiment, and broader economic conditions over time. They provide a useful framework for understanding long-term trends, but they cannot predict future price movements with certainty.
As Bitcoin becomes more integrated into the global financial system, future cycles will likely reflect a wider mix of factors than previous ones. Historical analysis works best when combined with current on-chain data, macroeconomic conditions, regulatory developments, and market fundamentals rather than viewed in isolation.
Bitcoin price forecasts are easy to find, but not all of them deserve the same level of attention. Further reading: . Some are built on measurable data and clearly stated assumptions, while others rely on speculation or attention-grabbing price targets with little supporting evidence. Knowing how to evaluate a forecast can help investors separate informed analysis from market hype.
A credible Bitcoin forecast should explain the reasoning behind its conclusions rather than focus only on a headline number. It should also account for factors such as macroeconomic conditions, institutional adoption, regulatory developments, and Bitcoin’s own market dynamics. Looking beyond the prediction itself allows readers to judge whether the analysis is supported by evidence or driven by opinion.
The following sections outline the key questions to ask when assessing a Bitcoin forecast, the assumptions that often shape price targets, and the warning signs that may indicate a forecast is less reliable than it appears.
A Bitcoin price forecast is only as reliable as the analysis behind it. Before considering a price target, it is worth examining who made the prediction, how they reached their conclusion, and whether the supporting evidence is clearly explained. Even forecasts that arrive at similar price targets can differ significantly in quality depending on the assumptions and methods used.
Begin by identifying who published the forecast. Established research firms, financial institutions, blockchain analytics companies, and experienced market analysts generally explain the reasoning behind their conclusions and often provide supporting data.
A source’s track record also matters. While no analyst can predict Bitcoin’s price with complete accuracy, reviewing previous forecasts can show whether their analysis has been balanced and consistent over time. Regularly updating forecasts as market conditions change is often a stronger sign of credibility than making bold predictions without revisiting them.
Experience should also match the subject. Analysts who regularly cover digital assets, macroeconomics, or on-chain data may provide more useful insights than commentators whose opinions are based mainly on short-term market sentiment.
Every forecast should be viewed in context, including the interests of the person or organization making it. Many analysts, companies, and investment firms openly disclose that they own Bitcoin or have exposure to the asset. Holding Bitcoin does not automatically reduce the value of their analysis, but it is useful to understand any financial interests that could influence their outlook.
Readers should also consider whether the forecast is being used to promote a product or service. Reports designed to attract customers, generate trading activity, or market investment products may naturally present a more optimistic view. Looking for clear disclosures and transparent reasoning can help place those predictions in the right context.
Every Bitcoin forecast depends on a set of assumptions, whether they are stated directly or implied throughout the analysis. Those assumptions often include continued institutional adoption, steady ETF inflows, favorable monetary policy, supportive regulation, growing network activity, or improving global liquidity.
Macroeconomic conditions deserve particular attention because they can influence investor demand across financial markets. Interest rates, inflation, central bank policy, and economic growth all affect the availability of capital and investors’ willingness to take on risk. Changes in any of these areas can alter Bitcoin’s price outlook, even if the network itself continues to grow.
Assumptions about regulation are equally important. A forecast based on improving regulatory clarity may produce a very different outcome from one that expects tighter restrictions on digital assets. Adoption trends also matter, as increased participation from institutions, businesses, or retail investors can strengthen demand over time.
Since these assumptions can change, forecasts should be viewed as scenarios rather than fixed outcomes. Understanding the conditions behind a prediction often provides more value than focusing on the price target alone.
| Question to Ask | Why It Matters |
| Who made the forecast? | Helps assess the source’s experience and credibility. |
| Is the methodology explained? | Shows how the price target was developed. |
| What assumptions are used? | Reveals the conditions required for the forecast to play out. |
| Are macroeconomic factors included? | Bitcoin’s price is influenced by broader financial markets. |
| Does the analysis discuss risks? | Balanced forecasts acknowledge uncertainty and alternative outcomes. |
| Are conflicts of interest disclosed? | Financial incentives may influence the outlook presented. |
| Is supporting data provided? | Evidence-based analysis is generally more reliable than opinion alone. |
| Does the forecast claim certainty? | Credible forecasts discuss probabilities rather than guarantees. |
Bitcoin price forecasts often attract attention with bold headlines and ambitious price targets. While eye-catching numbers can generate discussion, they reveal very little about the quality of the analysis behind them. A forecast becomes more valuable when it explains how the target was reached and identifies the factors that could influence the outcome.
Price targets such as “$250,000 Bitcoin” or “$1 million Bitcoin” often receive widespread attention, but the number itself should not be the main focus. Instead, readers should ask what evidence supports that prediction and whether the reasoning is clearly explained.
A well-supported forecast usually discusses the market conditions needed for the target to become realistic. It also explains the risks that could prevent the prediction from playing out. Without that context, even an accurate price target offers little value because readers cannot judge how realistic it is.
Reliable forecasts explain the methods used to arrive at a conclusion. Some analysts rely on historical market cycles, while others focus on on-chain metrics, valuation models, macroeconomic conditions, or supply-and-demand dynamics. Each approach has strengths and limitations, but the methodology should always be transparent.
Historical cycle analysis compares Bitcoin’s current position with previous market cycles to identify recurring patterns. On-chain analysis examines blockchain data, including wallet activity, exchange balances, and long-term holder behavior, to assess market conditions. Other forecasts may use valuation models that compare Bitcoin’s scarcity, adoption rate, or network growth with its market value.
No single method can predict Bitcoin’s future with certainty. Even so, forecasts supported by clear reasoning and measurable data generally carry more weight than those built on opinion alone.
Every Bitcoin forecast includes some level of uncertainty, but credible analysis makes that uncertainty clear instead of presenting predictions as facts. Analysts should distinguish between what current data suggests and what they believe could happen if market conditions remain favorable.
Readers should also look for multiple sources of evidence rather than relying on a single indicator. A forecast supported by historical data, on-chain metrics, macroeconomic analysis, and adoption trends provides a stronger foundation than one based on a single chart or narrative.
Speculation is a natural part of financial markets, especially in an asset as dynamic as Bitcoin. Still, opinions become far more useful when they are supported by transparent assumptions, reliable data, and a logical explanation of how the forecast was developed.
Every Bitcoin forecast is built on assumptions about how the market, the economy, and the network may change over time. Those assumptions shape the final price target, making them just as important as the prediction itself. Before relying on any forecast, readers should understand the conditions that must be met for it to play out.
Most Bitcoin forecasts assume that current trends will continue for some time. Many expect institutional demand to keep growing through spot Bitcoin ETFs, corporate treasury purchases, and greater participation from asset managers. Others assume adoption will continue as more businesses and individuals buy, use, or hold Bitcoin.
Broader economic conditions also play an important role. Lower interest rates, improving liquidity, and stable inflation can encourage investors to allocate more capital to assets like Bitcoin. Higher interest rates, slower economic growth, or rising uncertainty can have the opposite effect by reducing demand for risk assets.
Regulation is another key assumption. A forecast based on improving regulatory clarity may produce a very different outlook from one that expects stricter rules or legal challenges for the crypto industry.
Even small shifts in market conditions can change a Bitcoin forecast. A price target based on strong ETF inflows, for example, may become less realistic if investor demand slows. Likewise, forecasts that assume lower interest rates may need to be revised if central banks keep borrowing costs higher for longer.
Unexpected events can also reshape the market. Regulatory changes, geopolitical tensions, cybersecurity incidents, or sudden shifts in investor sentiment may influence Bitcoin’s price far more quickly than long-term models suggest. While these events are difficult to predict, they can quickly change the outlook behind an existing forecast.
For this reason, Bitcoin forecasts are best viewed as possible scenarios rather than fixed outcomes. Understanding the assumptions behind a prediction helps readers judge how realistic it is and identify the factors that could change its direction over time.
Not every Bitcoin forecast is based on careful analysis. Some are designed to attract attention, generate clicks, or encourage investment decisions without providing enough supporting evidence. Recognizing common warning signs can help readers separate credible analysis from overly optimistic or misleading predictions.
No one can guarantee how Bitcoin or any other financial asset will perform. Markets are influenced by many factors, including investor sentiment, economic conditions, regulation, and unexpected global events. Even the most experienced analysts cannot predict future prices with complete accuracy.
Any forecast that promises guaranteed profits or claims there is “no risk” should be treated with caution. Credible analysts acknowledge uncertainty and explain that their projections are based on probabilities rather than certainties.
Bitcoin forecasts often include specific price targets, but reliable analysis rarely presents them as inevitable outcomes. Statements claiming Bitcoin will reach a certain price by a specific date leave little room for changing market conditions or unexpected events.
Markets are constantly evolving, and forecasts should reflect that reality. Analysts who discuss different scenarios, possible risks, and alternative outcomes usually provide a more balanced view than those presenting a single prediction as fact.
Some forecasts rely more on emotion than evidence. Headlines such as “Last Chance to Buy Bitcoin,” “Guaranteed Millionaire Returns,” or “Bitcoin Is Going to the Moon” are designed to create excitement or fear of missing out rather than inform readers.
Emotional language can encourage rushed decisions by making investors feel they must act immediately. A stronger analysis explains both the opportunities and the risks, allowing readers to make informed decisions based on evidence instead of urgency.
It is worth noting that forced liquidations and leverage flushes can accelerate BTC price moves beyond spot market flows alone. Open interest and funding rates show how leveraged positioning can amplify price swings. Use these as market structure frameworks, not as tools for predicting individual candles.
Metrics such as open interest and funding rates can help explain why prices sometimes move sharply over short periods. However, they work best alongside broader market analysis rather than as standalone forecasting tools. Combining these indicators with on-chain data, macroeconomic conditions, and market sentiment provides a more balanced view of Bitcoin’s potential direction.
Bitcoin price forecasts can provide useful insight into possible market outcomes, but no model or analyst can predict future prices with complete certainty. Financial markets are influenced by a wide range of factors, many of which change quickly or cannot be anticipated. Even forecasts supported by historical data, on-chain metrics, and macroeconomic analysis remain subject to uncertainty.
Understanding the limitations of price forecasting is just as important as understanding the methods behind it. Unexpected economic developments, regulatory decisions, shifts in investor sentiment, and other external events can quickly alter market conditions and invalidate even the most carefully researched projections. Viewing forecasts as probability-based scenarios rather than guaranteed outcomes helps investors set realistic expectations and make more informed decisions.
Financial markets are constantly changing, and Bitcoin is no exception. Several factors influence its price, such as supply and demand, market liquidity, investor sentiment, and other unpredictable events. As these can change quickly, even well-researched analysis may become outdated.
Investor sentiment is arguably the most influential factor in the BTC price trend. Optimism can drive prices higher, while fear and panic selling happen because of uncertainty. In addition, new developments such as interest-rate decisions, regulatory changes, or shifts in investor demand can quickly affect market expectations.
As a result, Bitcoin predictions should be considered as formal forecasts that are highly informed but not definitive. They help investors anticipate possible market scenarios.
Even the most detailed Bitcoin forecast cannot account for every event that may affect the market. Some events occur with no warning and can suddenly change market sentiment, liquidity, and price direction. Often called black swan events, such rare, unexpected events can upend expectations based on historical data or the forecasting models mentioned above.
Bitcoin has had its share of external shocks that have altered market dynamics throughout its history. The COVID-19 pandemic triggered a sell-off across nearly all global financial markets in 2020, thwarting price increases before monumental monetary stimulus spurred a strong market rally.
In 2022, aggressive interest-rate hikes, surging inflation, and the collapse of several major crypto firms led to one of the deepest bear markets in Bitcoin’s history. More recently, the approval of spot Bitcoin ETFs has created a new institutional demand that was missing in past bear markets.
| Event Type | Possible Market Impact |
| Major regulatory announcement | Can trigger sharp buying or selling pressure. |
| Central bank interest-rate decision | Influences liquidity and demand for risk assets. |
| Global recession | May reduce investment demand and market liquidity. |
| Exchange collapse or major hack | Can weaken investor confidence and increase volatility. |
| Spot Bitcoin ETF approval | May attract new institutional capital and increase demand. |
| Corporate treasury adoption | Can strengthen long-term demand and market confidence. |
| Geopolitical conflict | Often increases uncertainty across financial markets. |
| Major technological or protocol developments | Can influence adoption and long-term market sentiment. |
These events are difficult to predict because they often develop outside the market itself. Most forecasting models rely on historical data and current market conditions, making them less effective when unexpected developments reshape the economic or regulatory environment.
Bitcoin investors closely watch certain price levels, including support and resistance, technical targets, and long-term forecasts. But none of these should be seen as permanent or guaranteed. Prices can move beyond even the strongest support and resistance when the market changes hands.
Support and resistance levels come from observing market activity, not from fixed rules. A level that was once strongly supported may fail if selling pressure increases. Similarly, resistance can be surpassed when buying demand exceeds expectations.
The same principle applies to price forecasts. Regardless of whether a prediction comes from cycle analysis, on-chain data, technical analysis, or macroeconomic modeling, all price forecasts reflect the data available at the time.
This content is provided for educational and informational purposes only and should not be considered financial, investment, legal, or tax advice. Bitcoin price forecasts and market analysis are based on historical data, current market conditions, and assumptions that may change over time. Financial markets are inherently uncertain, and past performance does not guarantee future results.
Before making any investment decisions, conduct your own research, assess your financial situation and risk tolerance, and consider seeking advice from a qualified financial professional. Any investment in Bitcoin or other digital assets carries the risk of partial or total loss of capital.
Bitcoin is currently trading at approximately $63,930. Its price changes continuously as buying and selling activity takes place across global exchanges, so the value may differ by the time you check it.
Key levels include support and resistance zones, recent highs and lows, major moving averages, and psychological price levels. These areas often influence trading activity but can break if market conditions change.
Bitcoin’s price is driven by supply and demand, investor sentiment, institutional adoption, macroeconomic conditions, regulation, and network activity. Short-term moves can also be influenced by ETF flows, leveraged trading, and market liquidity.
Based on the forecast used in this guide, Bitcoin is expected to reach approximately $78,597 by the end of 2026, representing a 23.35% increase from current levels. Like all forecasts, this estimate depends on market conditions and should be viewed as a possible scenario rather than a guarantee.
Bitcoin price predictions can offer useful insights, but they are never certain. The most reliable forecasts explain their methodology, assumptions, and supporting data while acknowledging the risks and limitations.
Combine several forms of analysis, including price trends, on-chain data, technical indicators, and macroeconomic factors. Reviewing multiple sources and understanding the assumptions behind each forecast can help you make more informed decisions.
Btc Price Analysis Bitcoin Eyes 83k As Binance Open Interest Tops 10b
CLARITY Act Odds Just Spiked, and Bitcoin Already Felt It
Bitcoin’s Drop Looks Like 2022 All Over Again
Bitcoin Price Eyes $83K as TD Sequential Flashes Buy Signal Ahead of FOMC
Bitcoin, Ethereum and XRP Flash Buy Signals After Major Sell-Off
Bitcoin Bond Market: Why Treasury Yields Could Matter More Than the Fed
Bitcoin Eyes $89,000 as Whales Add 16,010 BTC During the Dip
Explore more