Key Points
- Bitcoin price remained elevated and opened the week on the positive note against the US Dollar.
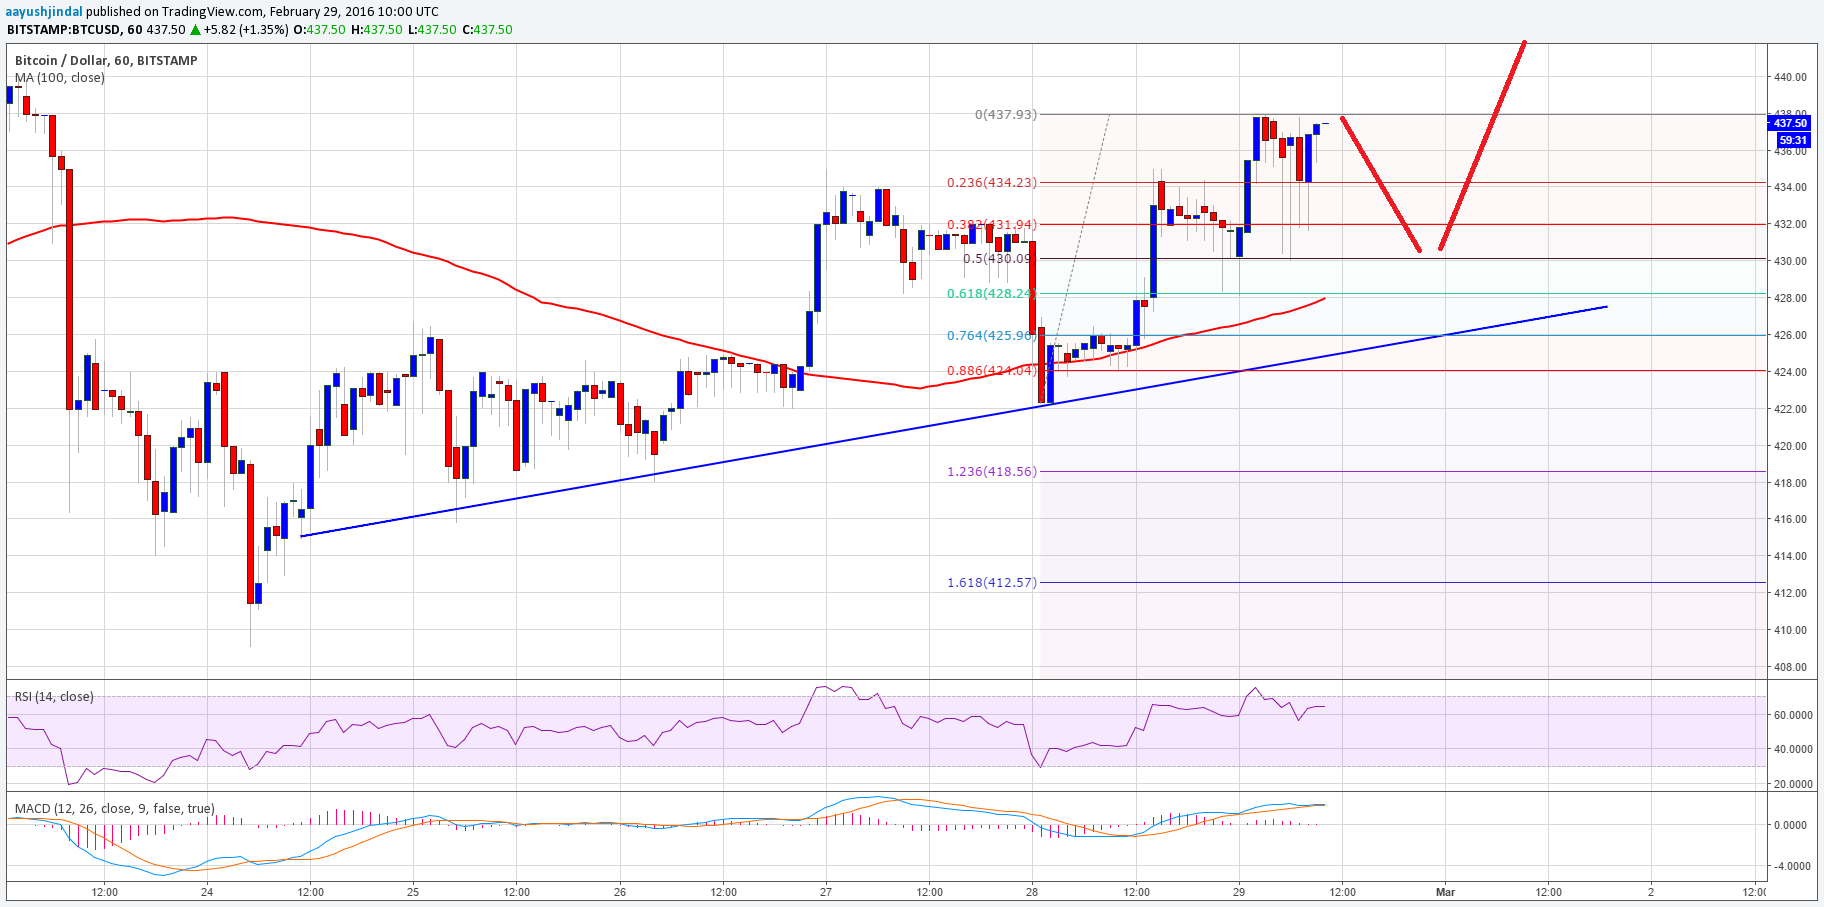
- There is a major bullish trend line formed on the hourly chart (data feed from Bitstamp), which may act as a buy zone in the near term.
- The price is also above the 100 hourly simple moving average, which is a positive sign for the bulls.
Bitcoin price trading near the $440 area, so there is a chance of a minor correction from the current levels.
Bitcoin Price Buy
It is like every dip in Bitcoin price was bought by buyers against the US dollar. The price is currently heading higher and trading near the $440 resistance area. So, there is a possibility of it moving or correcting down in the short term. However, any correction from the current levels may find buyers in the short term.
There is a major bullish trend line formed on the hourly chart (data feed from Bitstamp), which may act as a barrier for sellers and prevent the downside move. An initial support on the downside can be around the 38.2% Fib retracement level of the last wave from the $422 low to $437 high.
However, the most important support area on the downside might be around the 100 hourly simple moving average (data feed from Bitstamp). It is also aligned with the 61.8% Fib retracement level of the last wave from the $422 low to $437 high to act as a buy zone for the price. Any further downside move may take the price towards the trend line and support area.
Looking at the technical indicators:
Hourly MACD – The hourly MACD is about to change the slope to bearish, calling for a minor correction.
RSI (Relative Strength Index) – The hourly RSI is above the 50 level, which is a positive sign for the bulls.
Intraday Support Level – $430
Intraday Resistance Level – $440
Charts from Bitstamp; hosted by Trading View
