Key Points
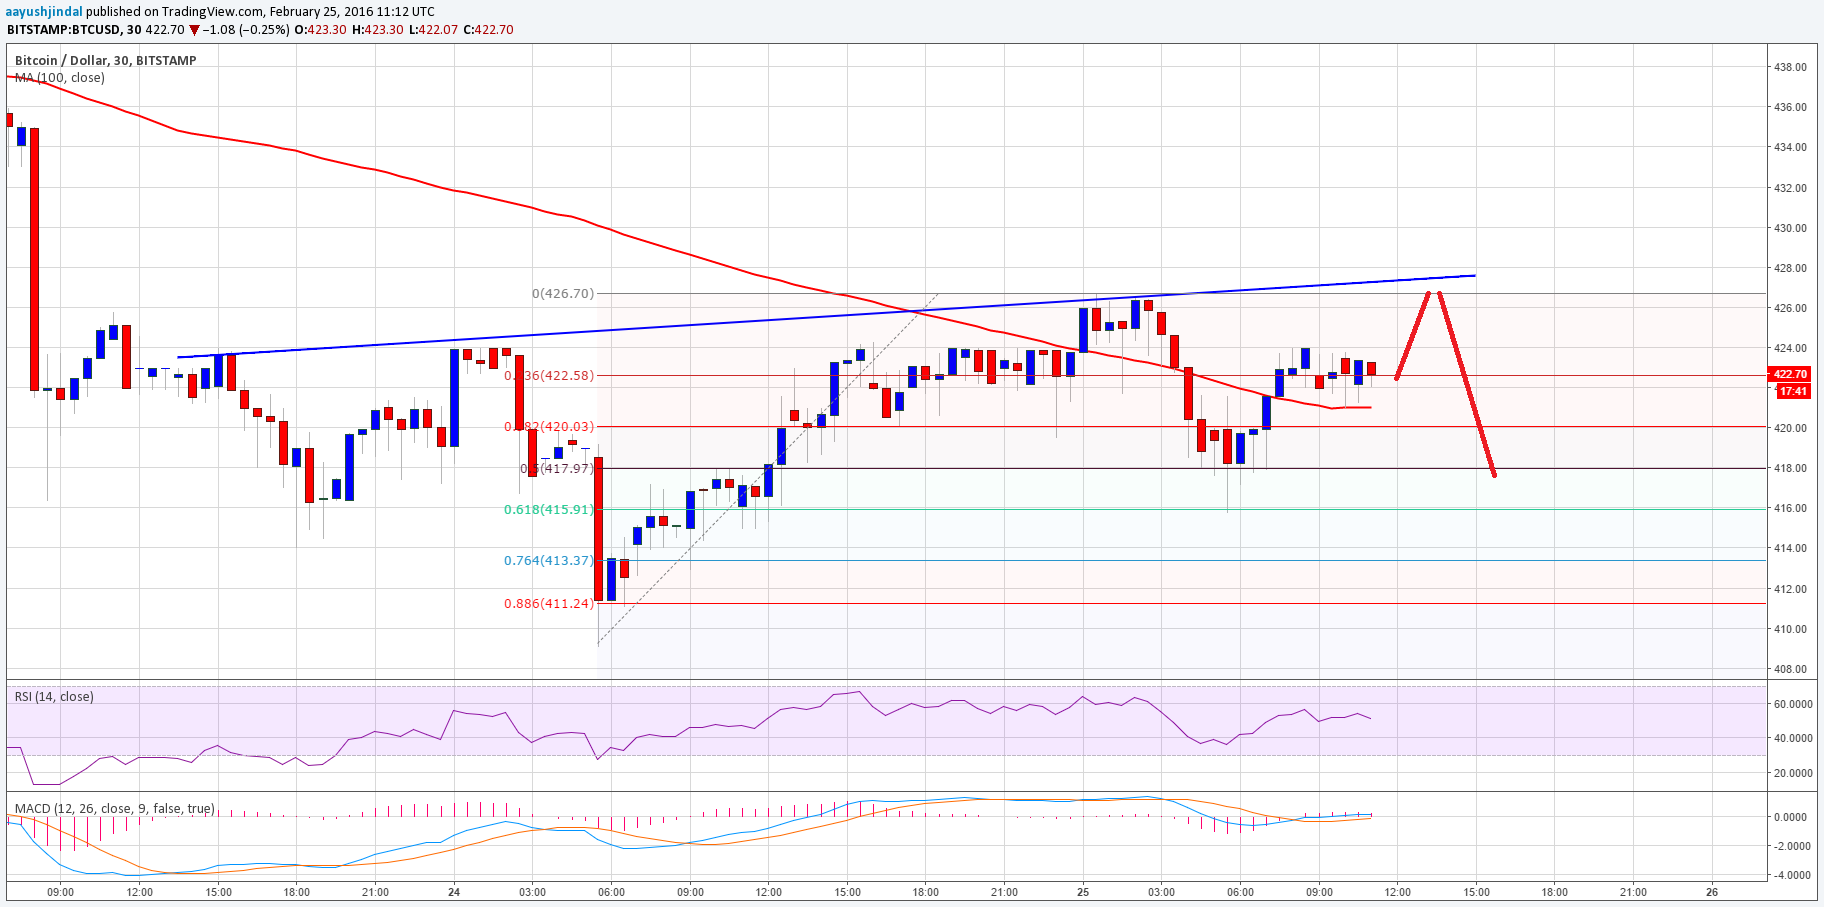
- Bitcoin price after trading down found support near $410 and traded higher back towards $420.
- There is a minor bearish trend line formed on the 30-min chart (data feed from Bitstamp), which may act as a resistance moving ahead.
- The price is above the 100 simple moving average (30-min), but not encouraging enough to call for a sharp upside move.
Bitcoin price traded higher to test $425, corrected back down and now it looks it may attempt a move back towards the $425-30 area.
Bitcoin Price Watch
There was a downside move in Bitcoin price towards the $410 level where buyers appeared to prevent a downside move. The price recovered well, and later there was a move towards the $425 level where there was a bearish trend line on the 30-min chart (data feed from Bitstamp) that acted as resistance. The price moved down once again as to an extent our sell idea worked of selling rallies.
The price already dipped and tested the 61.8% Fib retracement level of the last wave from the $409 low to $426 high. So, we can say that a correction phase is complete and the price may head back higher.
The best part is that the price is above the 100 simple moving average (30-min, data feed from Bitstamp). So, it may ignite a minor rally. However, we need to keep a close eye on the highlighted trend line and resistance area as it may play a major role in the short term. On the downside, the $420 level can be seen as a support area.
Looking at the technical indicators:
30-min MACD – The hourly MACD is in the bullish zone, which is a positive sign for the bulls.
RSI (Relative Strength Index) – The 30-min RSI is above the 50 level, suggesting a short-term move higher.
Intraday Support Level – $420
Intraday Resistance Level – $425
Charts from Bitstamp; hosted by Trading View
