
Key Points
- Bitcoin price moved down and traded below an important support area on the hourly chart.
- A couple of support trend lines on the hourly chart (data feed from Bitstamp) were broken to clear the way for more losses.
- The price is now below the 100 hourly simple moving average, which is a bearish sign for sellers.
Bitcoin price moved down, and it looks like there is a chance of it heading towards the $400 level in the near term.
Bitcoin Price- Sell rallies?
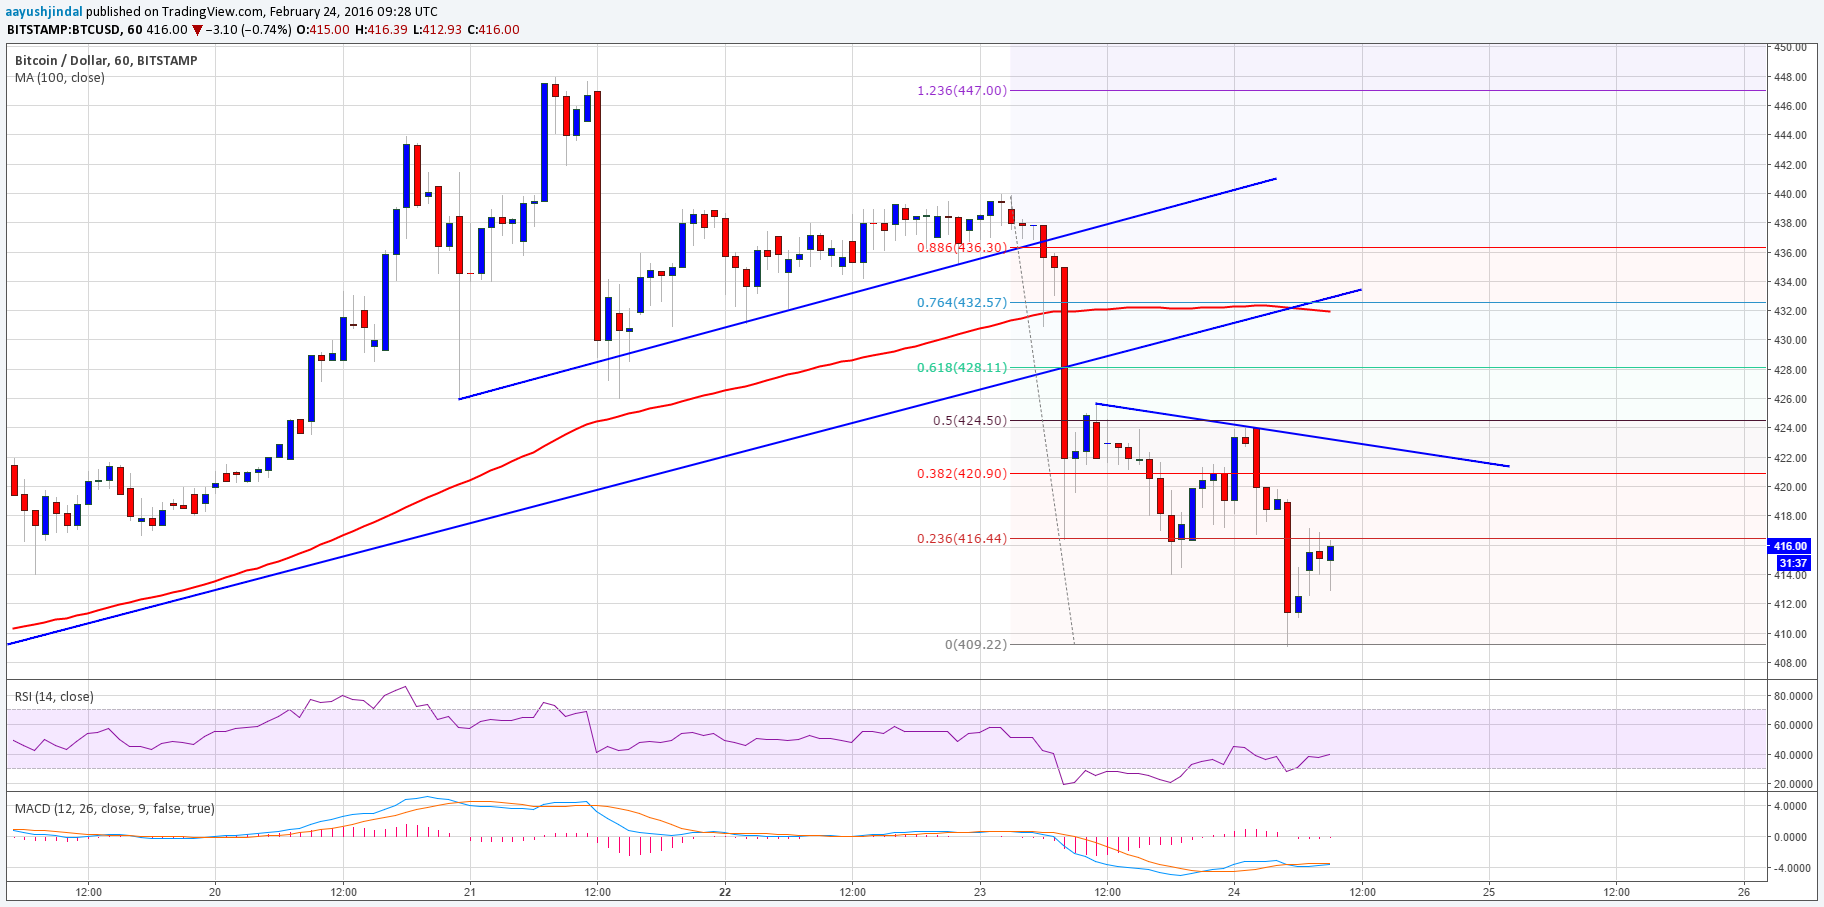
Bitcoin price after trading close to the $450 level found sellers and it started to move down. The $430 support area was broken to open the doors for more losses in the near term. Moreover, there were a couple of support trend lines on the hourly chart (data feed from Bitstamp) broken to encourage sellers to take the price down. The price traded as low as $409 where it found buyers and currently attempting to correct higher.
There is now a bearish trend line formed on the hourly chart, which may act as a sell area if the price moves higher from the current levels. On the upside, an initial resistance is around the 38.2% Fib retracement level of the last drop from the $440 high to $409 low. A break above the trend line and resistance area could take the price higher moving ahead.
The next important resistance is around the 100 simple moving average (hourly, data feed from Bitstamp), which is aligned with the 76.4% Fib retracement level of the last drop from the $440 high to $409 low.
Looking at the technical indicators:
Hourly MACD – The hourly MACD is in the bearish zone, which is a negative sign for the bulls.
RSI (Relative Strength Index) – The hourly RSI is below the 50 level, calling for more losses in the near term.
Intraday Support Level – $409
Intraday Resistance Level – $425
Charts from Bitstamp; hosted by Trading View