Tag: Bitcoin Price chart

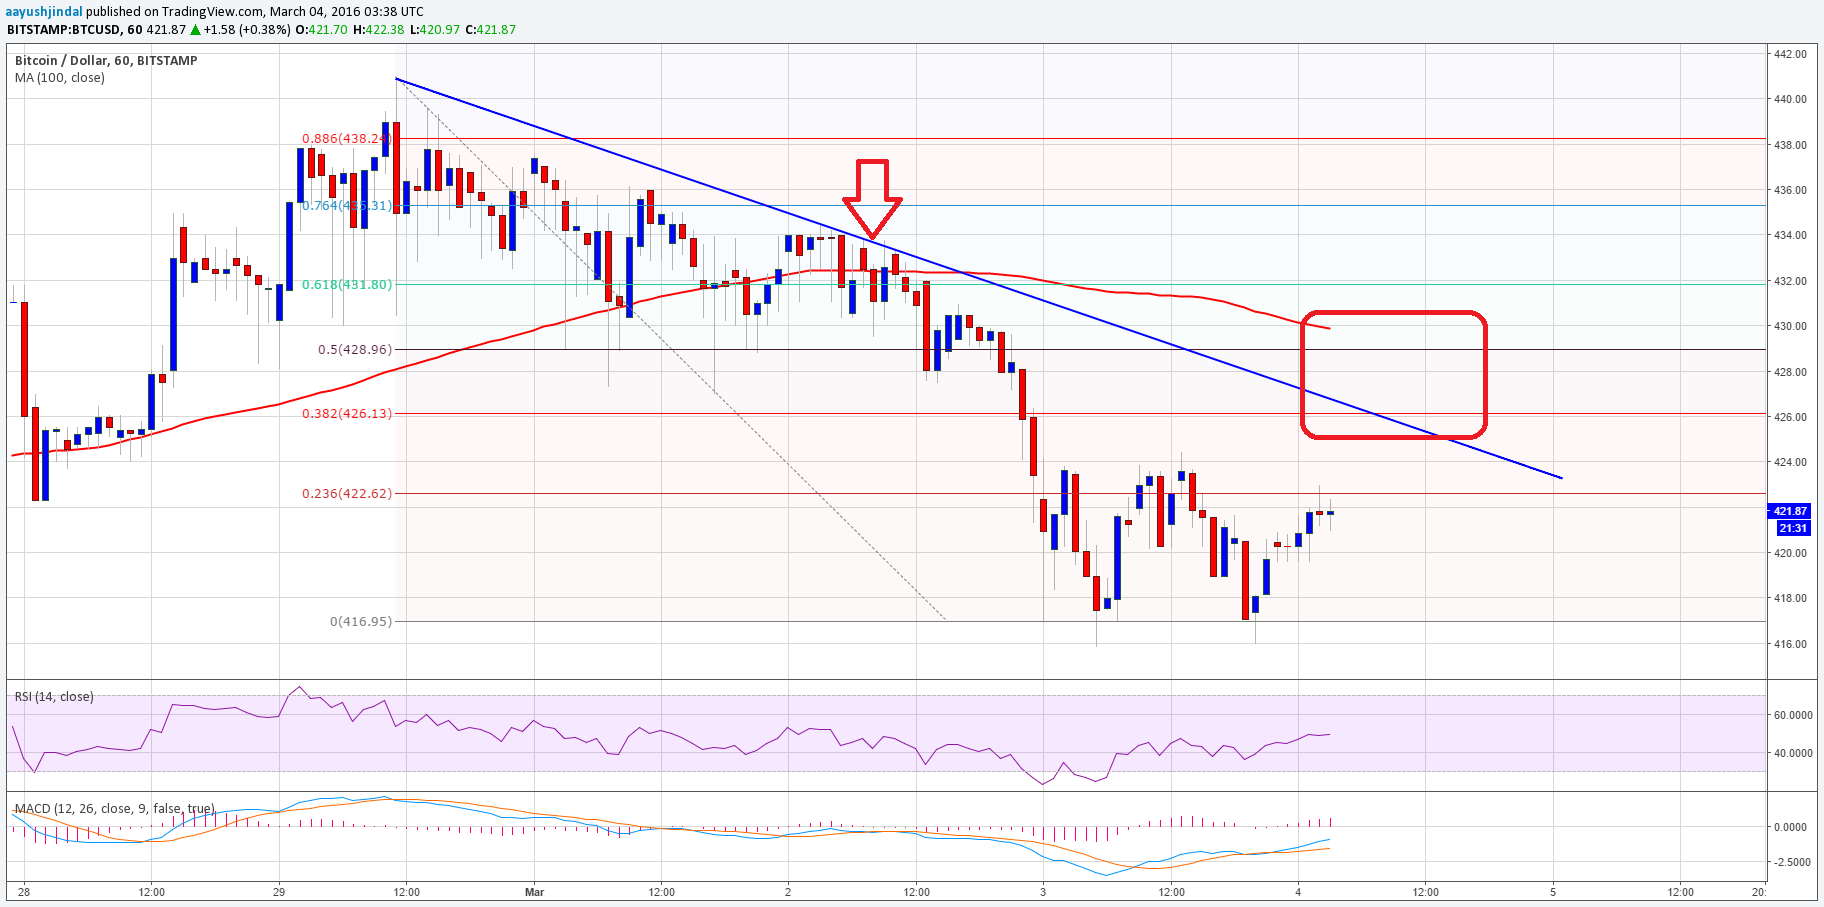
Bitcoin Price Technical Analysis – Selling Worked, Now What?
Key Points Bitcoin price corrected a few points higher after collapsing, and yesterday’s sell idea worked. The price struggled to gain traction, and it looks…
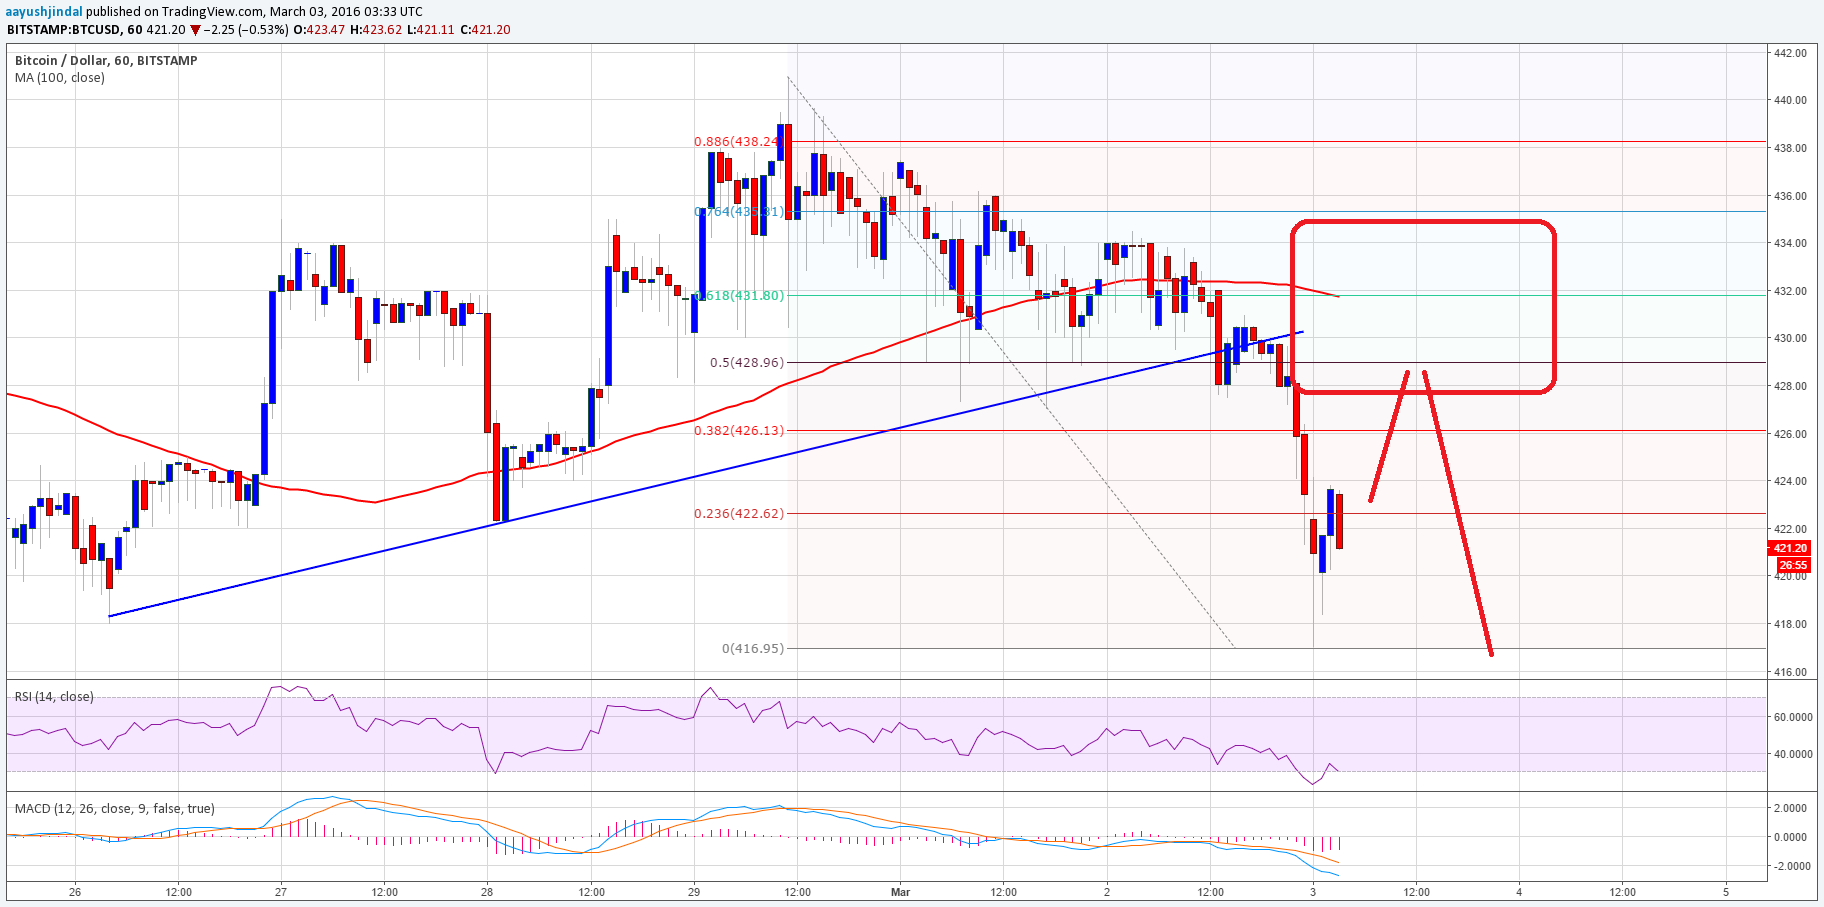
Bitcoin Price Technical Analysis – Sellers Take First Step
Key Points Bitcoin price after trading in a range for some time finally broke down and traded lower. Yesterday’s highlighted bullish trend line on the…
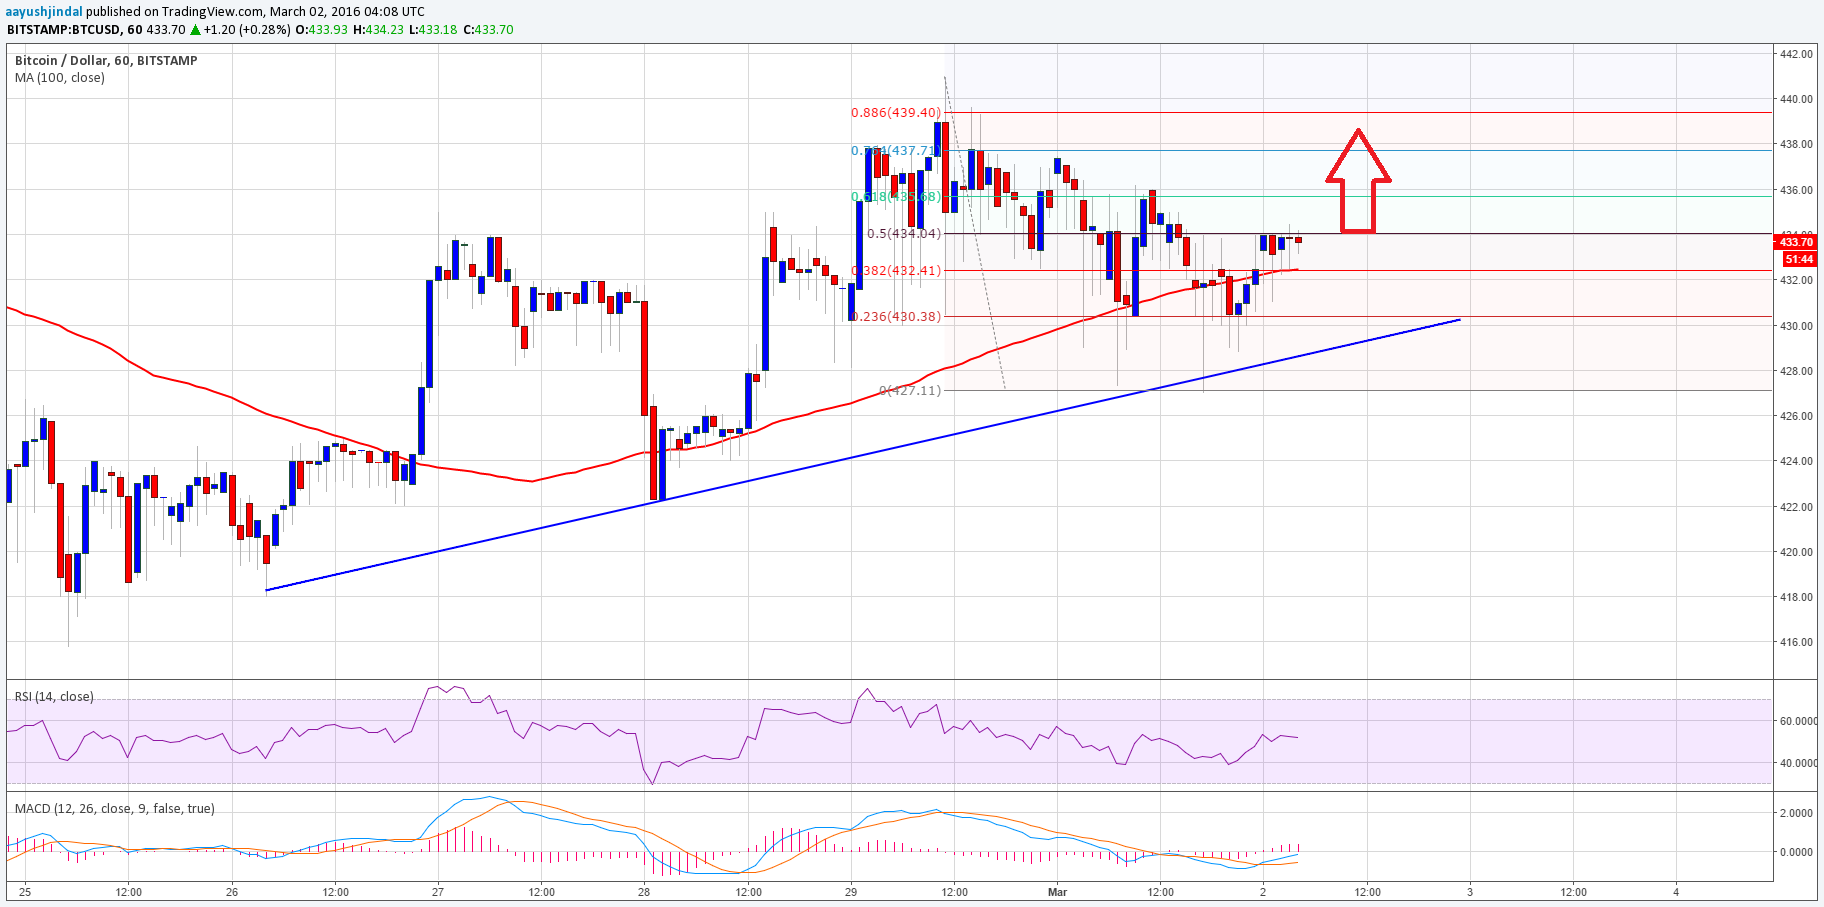
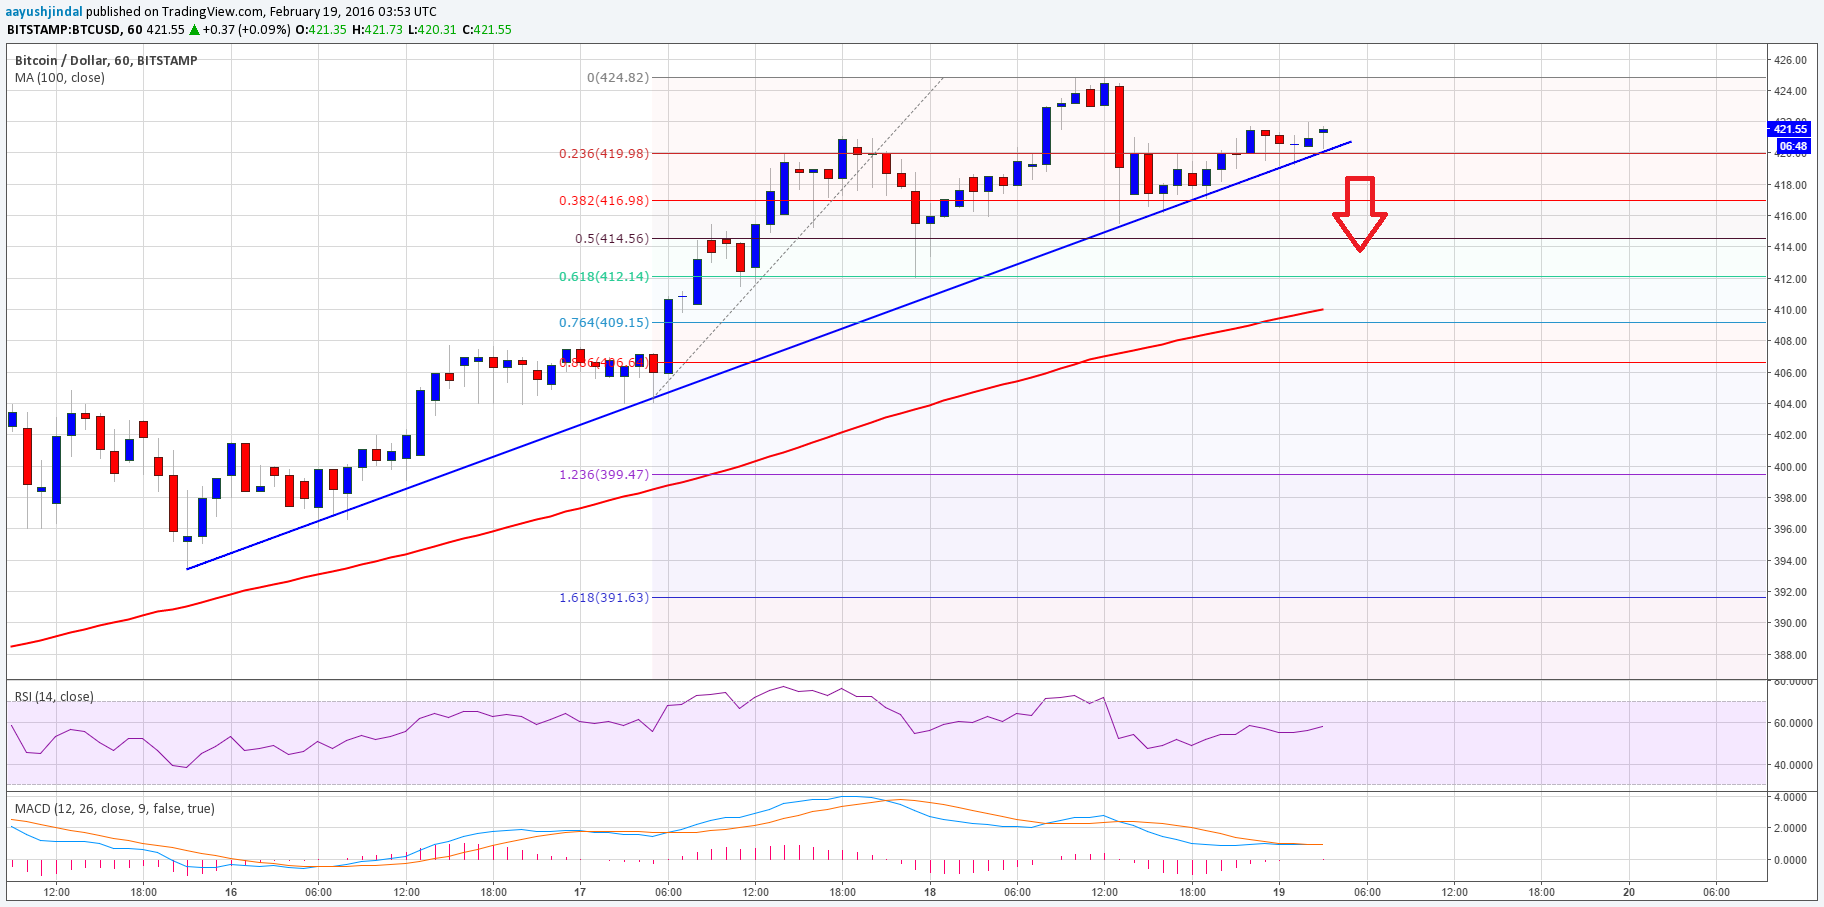
Bitcoin Price Technical Analysis – Another Leg Higher?
Key Points Bitcoin price is trading in a tiny range, and waiting for a catalyst for the next move. There is a bullish trend line…
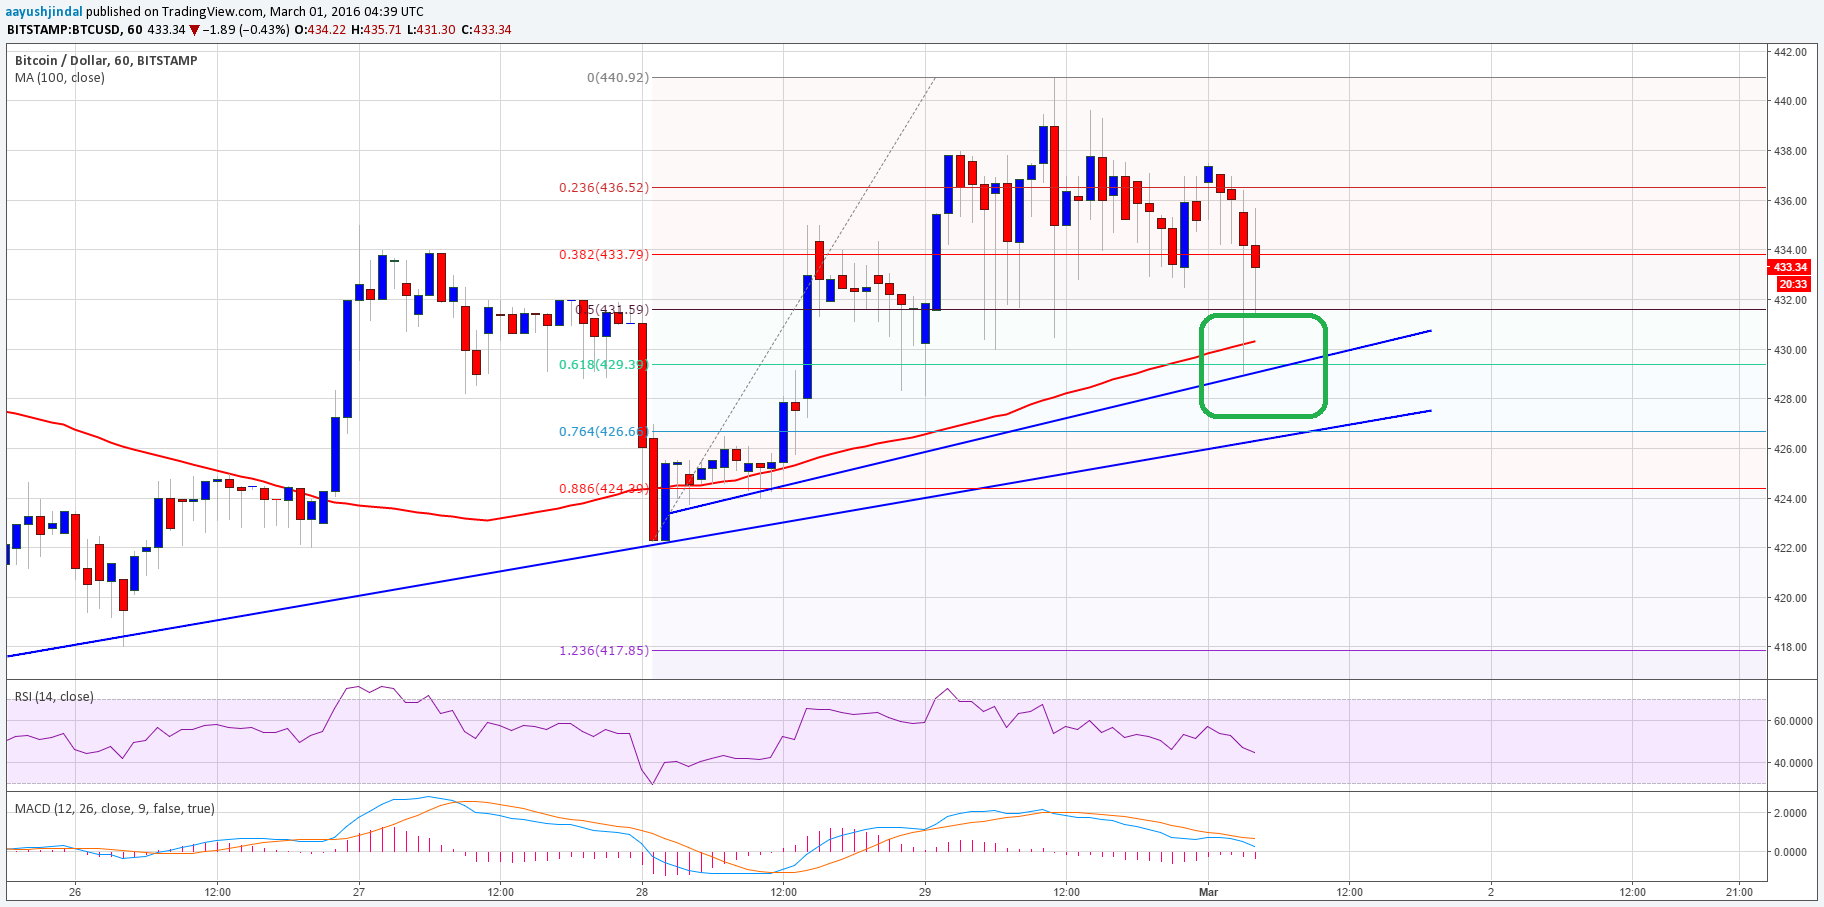
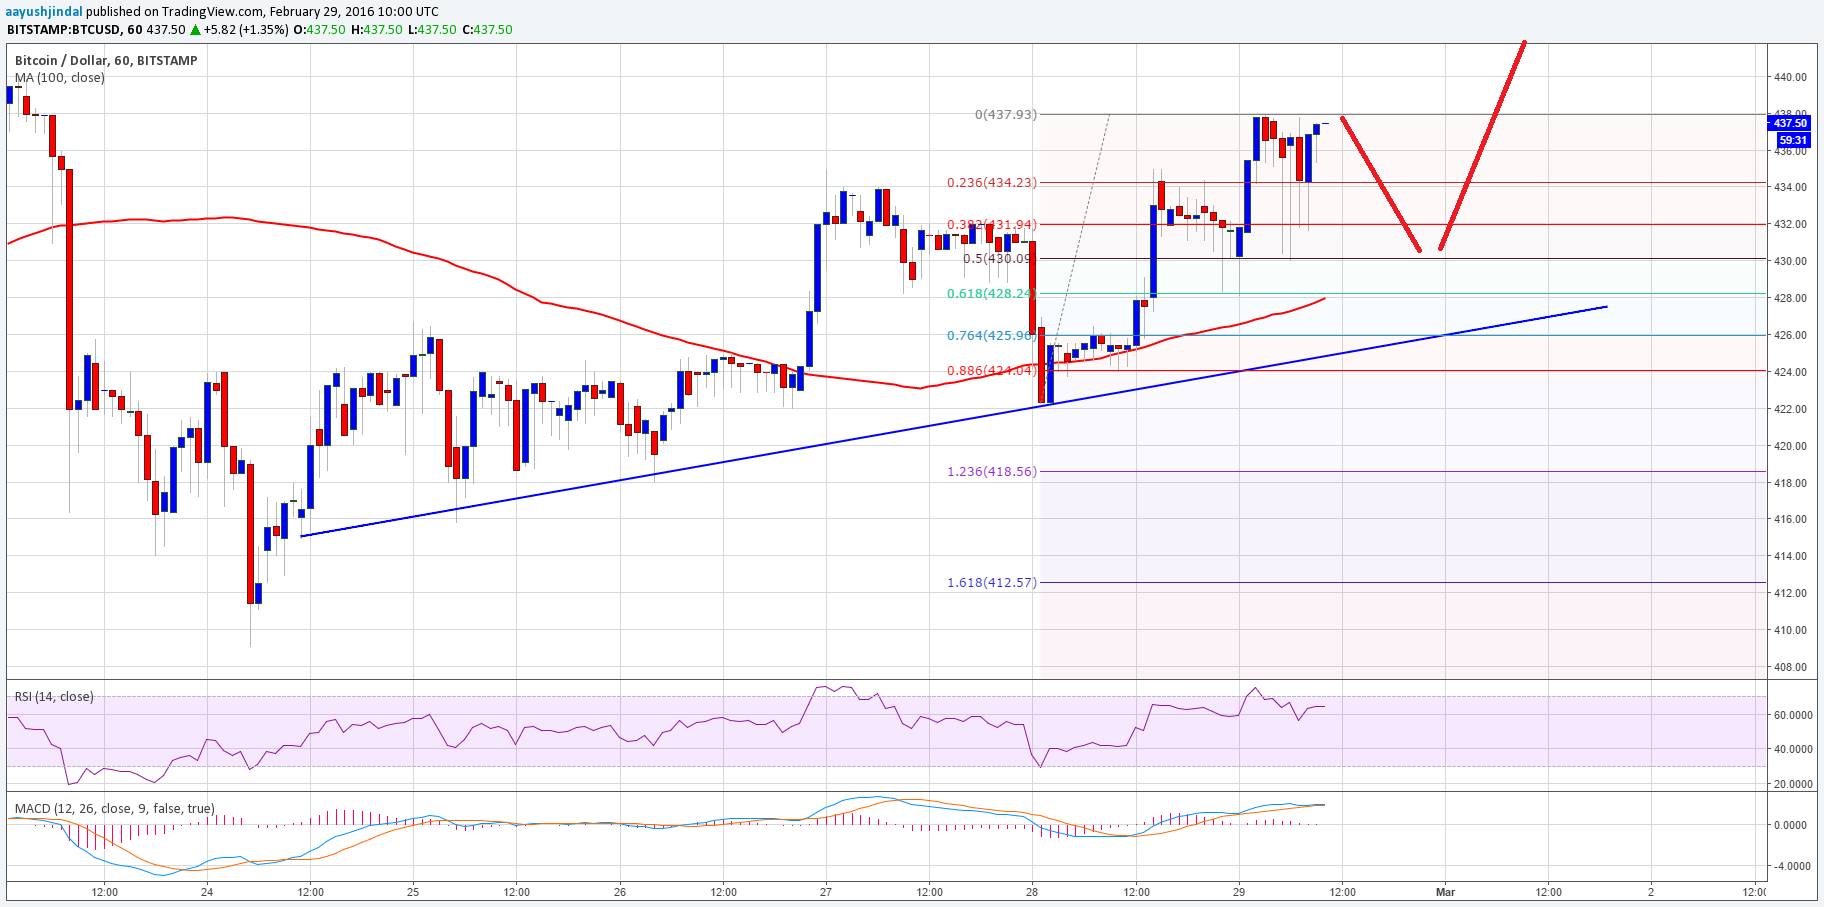
Bitcoin Price Technical Analysis – 100 MA As Support
Key Points Bitcoin price continued to move higher against the US dollar, and it looks like our buying dips idea worked. Our yesterday’s highlighted bullish…
Bitcoin Price Technical Analysis – Buying Dips Favored
Key Points Bitcoin price remained elevated and opened the week on the positive note against the US Dollar. There is a major bullish trend line…
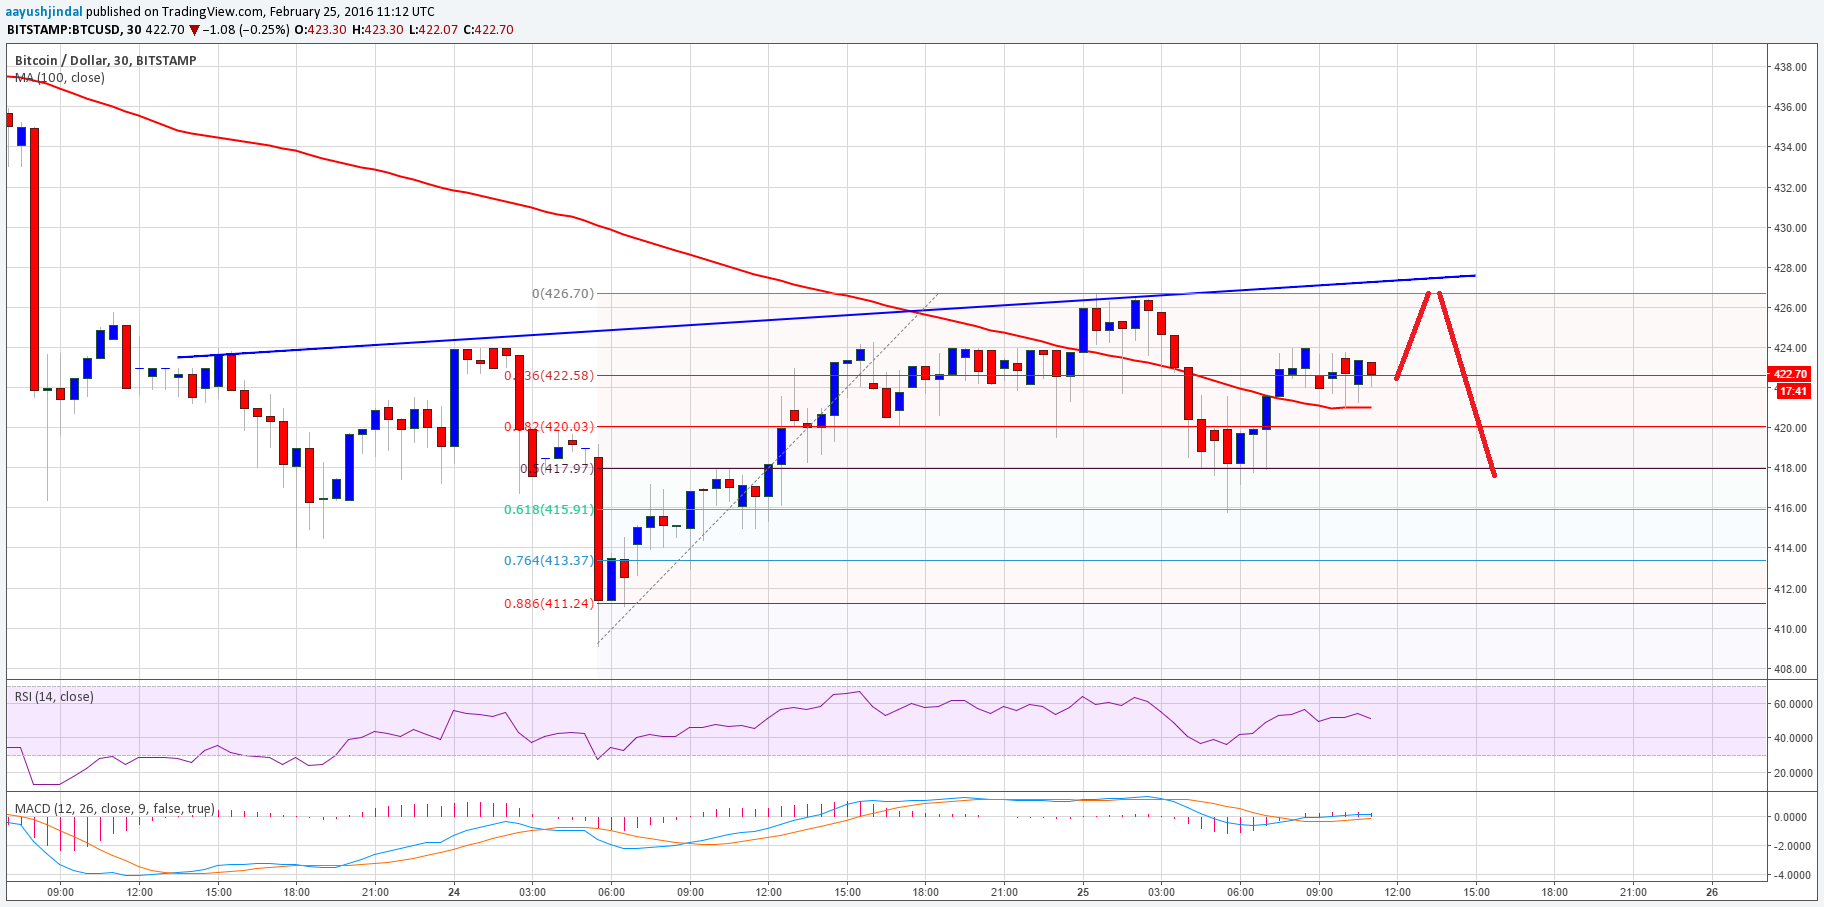
Bitcoin Price Technical Analysis – Retest of $430 Likely?
Key Points Bitcoin price after trading down found support near $410 and traded higher back towards $420. There is a minor bearish trend line formed…
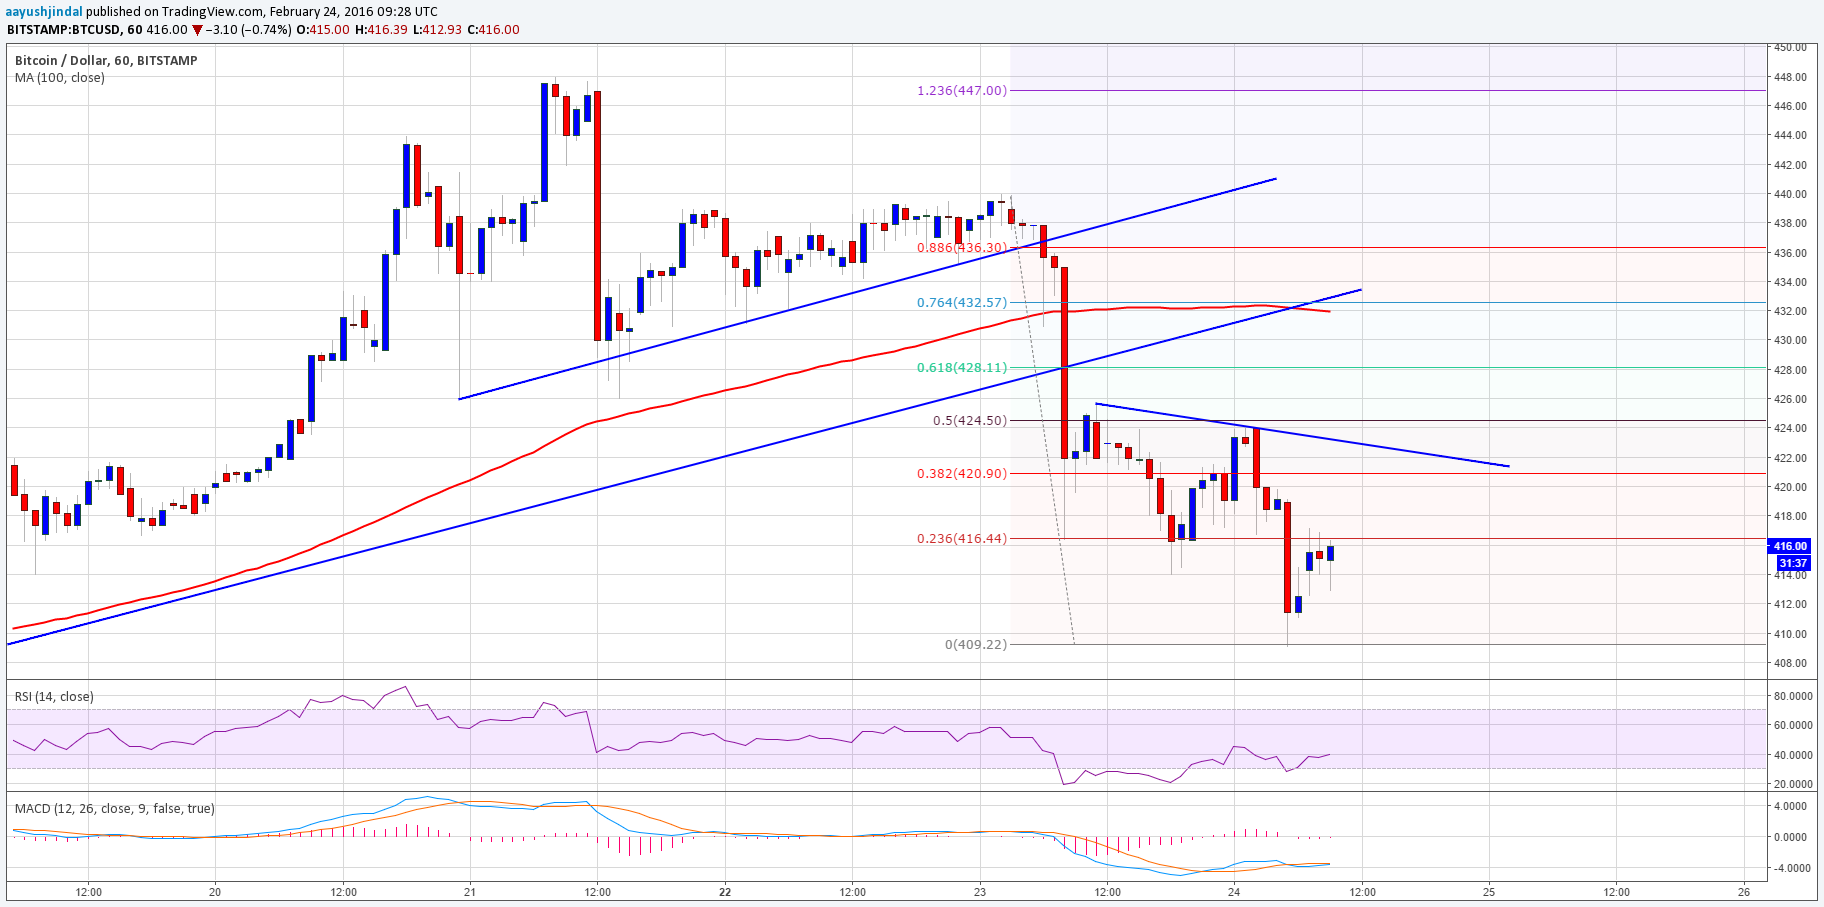
Bitcoin Price Technical Analysis – Perfect Downside Break
Key Points Bitcoin price moved down and traded below an important support area on the hourly chart. A couple of support trend lines on the…
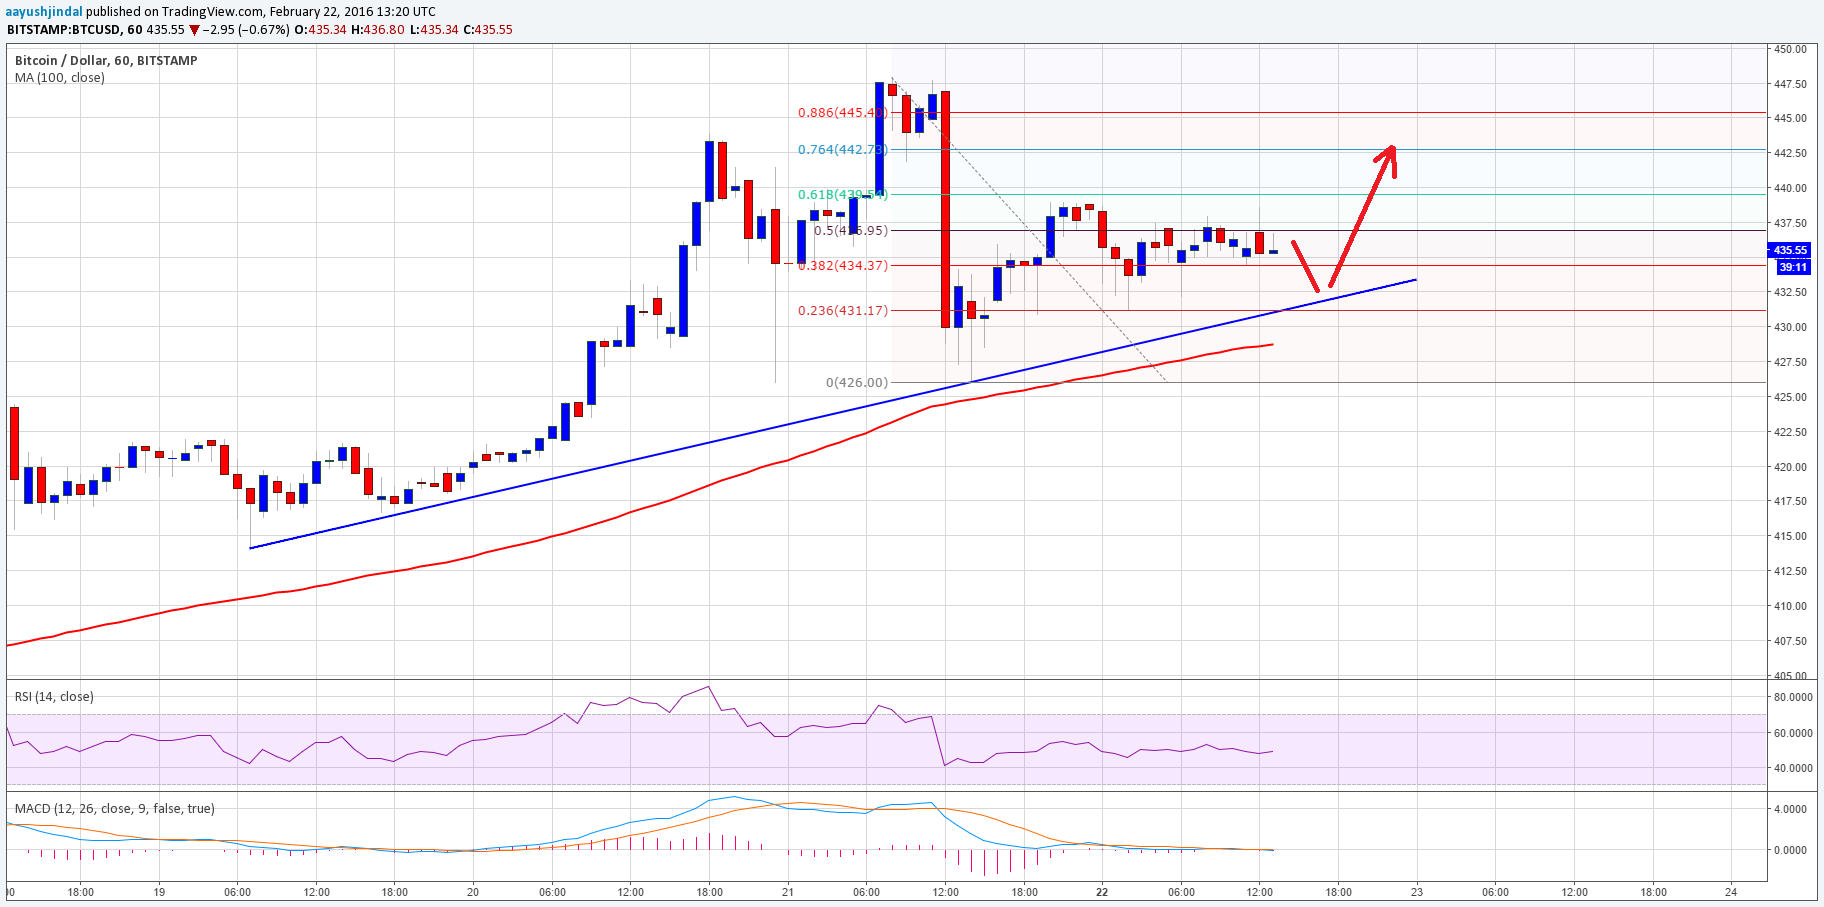
Bitcoin Price Technical Analysis – Looks to Trade Higher
Key Points Bitcoin price traded above the $440 level, and it looks like our final target of $450 is almost achieved. The price found sellers…
Bitcoin Price Technical Analysis – Trend Line Support At Risk
Key Points Bitcoin price traded further higher and created a new high Intraday, as it traded above $420. However, the upside was limited in Bitcoin…