
Bitcoin trades near $76,701 after losing key support as traders watch $76,600 recovery and $79,100 CME gap.
Bitcoin traded near $76,701 on the daily chart as traders assessed a weaker technical setup.
The market lost the $75,000 to $76,000 support area during a Friday correction, and attention has shifted to whether Bitcoin can recover $76,600.
A move back above that level may improve short-term momentum, while failure could keep price exposed to the $60,000 range.
Bitcoin Loses Key Support Zone
Bitcoin’s latest move placed the market near a major decision area. The $75,000 to $76,000 zone had acted as short-term support.
Its loss has raised caution among traders watching the daily structure. The chart shows Bitcoin below several Fibonacci retracement levels.
The breakdown under $82,254, the 0.786 Fibonacci level, remains important. Price has not reclaimed that level, so the recovery remains limited.
Michaël van de Poppe said Bitcoin “needed to sustain above $75,000 to $76,000.” The same trader added that “breaking back above $76,600 would be important for upward momentum.”
#Bitcoin is getting weaker and might break into the $60Ks again.
It lost a crucial level of support, and by doing that, there's a lot of fear whether or not we'll be seeing any upwards momentum from here.
Notably, I wanted it to sustain above $75,000-76,000, but on a classic… pic.twitter.com/KIMjjGsckv
— Michaël van de Poppe (@CryptoMichNL) May 23, 2026
Bitcoin is still trading above the lower Fibonacci area near $70,123. That level marks a key support on the displayed chart.
A daily close below current levels could bring that zone back into focus.
Traders Watch $76,600 Recovery Level
The $76,600 area has become a short-term level for market direction. A move above it could show renewed buyer activity.
It may also reduce pressure from the latest support break. However, traders remain cautious while Bitcoin stays below $80,000.
The next resistance range is near $80,000 to $82,254. A move above that area would improve the broader chart structure.
The chart also shows higher resistance near $91,777 and $98,466. These levels match the 0.618 and 0.5 Fibonacci retracements.
Bitcoin would need to recover them before testing higher ranges. The upper resistance zones remain at $105,155 and $113,431.
The prior high range sits near $120,000 to $126,800. Those levels remain distant while price trades in the mid-$70,000 area.
Read Also:
Bitcoin Falls Below 2 Year MA as Traders Eye Fresh Accumulation Zone
Momentum Indicators Remain Weak
The MACD reading remains bearish on the displayed daily chart. The MACD line is near minus 216, while the signal line is near 334.
The histogram is near minus 549. This setup shows that sellers still have control of short-term momentum.
Yet the negative reading is not as deep as earlier selling phases. That suggests the pace of selling may be easing.
The RSI is near 45.72, with its moving average near 50.18. This places the indicator below the neutral 50 level. It also shows that buyers have not regained clear control.
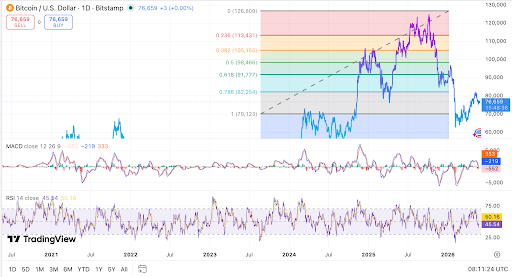
Bitcoin is not oversold on the daily chart. That means the price may still move lower if support fails.
A recovery above RSI 50 would support a stronger rebound attempt. Some traders are also watching CME gaps above spot price.
Weekend corrections can leave gaps when futures markets reopen. The highest gap mentioned by traders sits near $79,100.
Altcoins remain tied to Bitcoin’s next move. Traders are watching whether they recover faster if Bitcoin finds support. Volatility remains high, so risk control remains a key market theme.


Leave a Reply
You must be logged in to post a comment.