
- ADA price started a nasty decline after it broke the $0.0600 support against the US Dollar.
- The price even traded below the $0.0550 support level to enter a bearish zone.
- There is a major bearish trend line forming with resistance near $0.0580 on the 4-hours chart (data feed via Kraken).
- The price remains at a risk of more losses below the $0.0520 and $0.0500 levels in the near term.
Cardano price is down more than 5% and trading in a bearish zone against the US Dollar, similar to bitcoin. ADA price could continue to slide if it breaks the $0.0510 support area.
Cardano Price Analysis
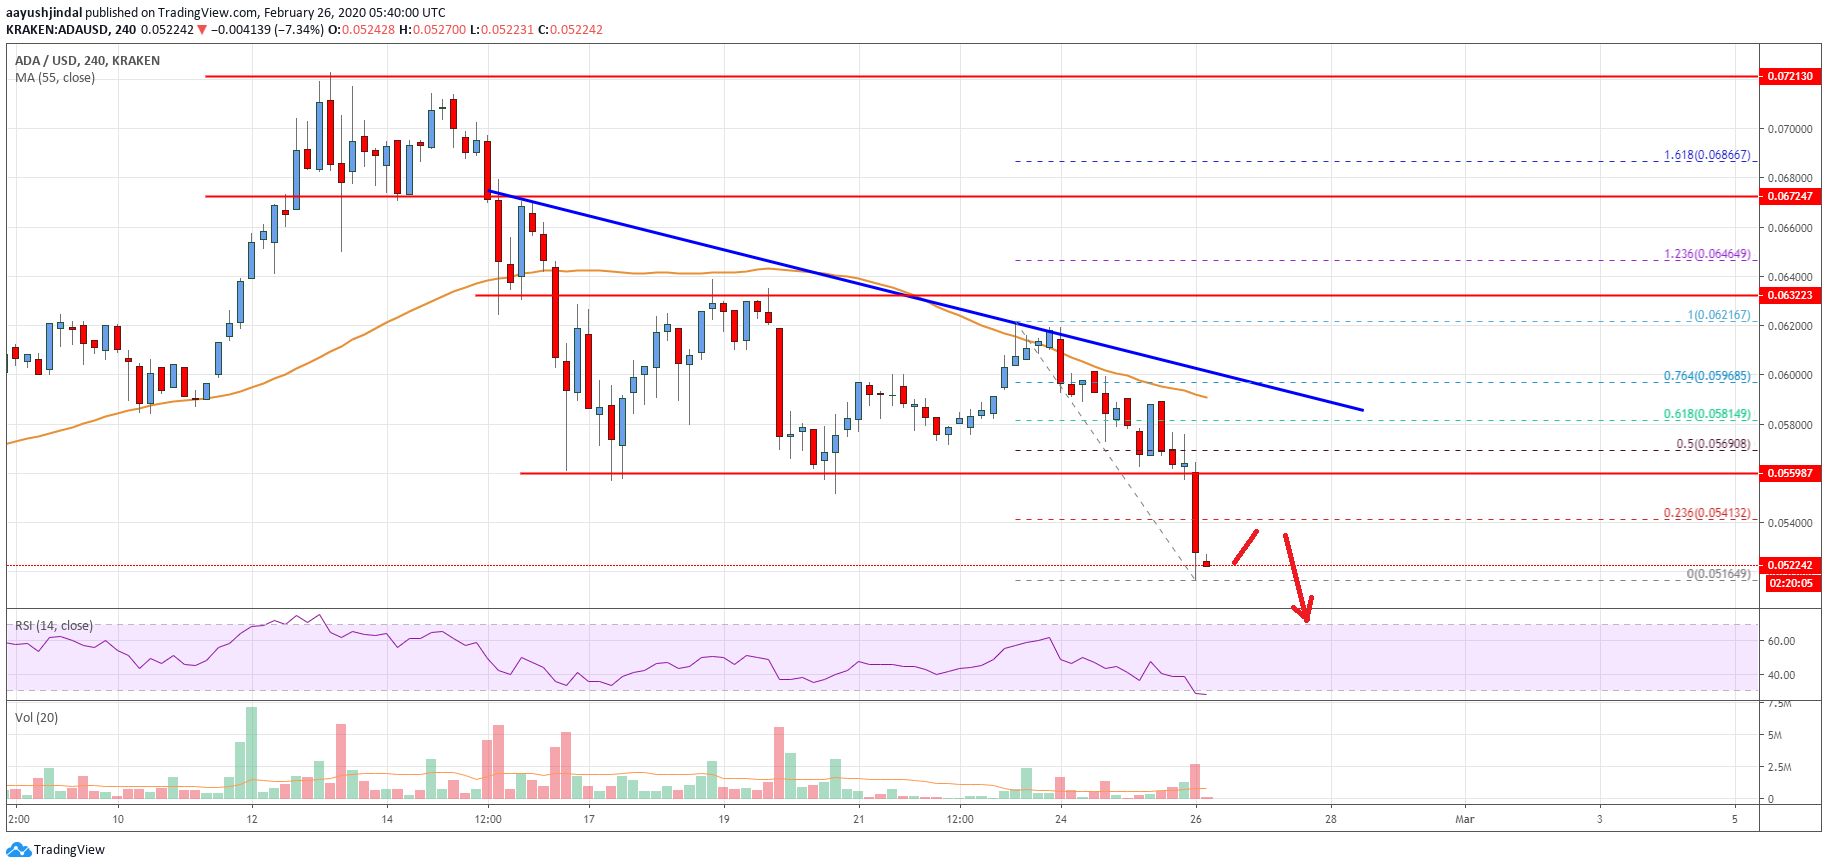
In the past few days, cardano price started a major decline below the $0.0600 support area against the US Dollar. The ADA/USD pair even declined below the $0.0580 pivot level and the 55 simple moving average (4-hours).
It opened the doors for more losses and the price even traded below the $0.0550 support level. Finally, it spiked below the $0.0520 level and a new weekly low is formed near the $0.0516 level.
The price is currently consolidating losses and trading above the $0.0520 level. An initial resistance on the upside is near the $0.0541 level. It coincides with the 23.6% Fibonacci retracement level of the downward move from the $0.0621 high to $0.0516 low.
The first major resistance is seen near the $0.0550 and $0.0560 levels. Besides, the 50% Fibonacci retracement level of the downward move from the $0.0621 high to $0.0516 low is also near the $0.0569 level to act as a hurdle.
More importantly, there is a major bearish trend line forming with resistance near $0.0580 on the 4-hours chart. Therefore, upsides are likely to remain capped in cardano price near the $0.0560 and $0.0580 levels.
To start a fresh increase, the bulls need to break the $0.0580 area and then gain pace above the $0.0600 level. If not, there is a risk of more downsides below $0.0520 and $0.0510.
The main support is near the $0.0500 level, below which the price is likely to tumble below the $0.0480 and $0.0475 levels in the near term.
The chart indicates that ADA price is clearly back in a bearish zone below the $0.0550 level. There could be a minor correction, but as long as the price is below $0.0580, it could continue to move down.
Technical Indicators
4 hours MACD – The MACD for ADA/USD is currently gaining momentum in the bearish zone.
4 hours RSI – The RSI for ADA/USD is now well below the 40 level.
Key Support Levels – $0.0510 and $0.0500.
Key Resistance Levels – $0.0560 and $0.0580.


Leave a Reply
You must be logged in to post a comment.