
- ADA price is struggling to clear the $1.40 resistance against the US Dollar.
- The price is now testing the $1.30 support and the 55 simple moving average (4-hours).
- There is a major bullish trend line forming with support near $1.30 on the 4-hours chart (data feed via Bitfinex).
- The price could extend its decline, but the bulls might protect the $1.20 and $1.15 support levels.
Cardano price is facing an uphill task near $1.40 against the US Dollar, similar to bitcoin. ADA price must stay above $1.20 to remain in a positive territory.
Cardano Price Analysis
After trading close to the $1.20 support, cardano price started a fresh increase against the US Dollar. The ADA/USD pair broke the $1.25 resistance to move into a positive zone.
The price even climbed above the $1.35 level and settled nicely above the 55 simple moving average (4-hours). However, the bears were again active near the $1.40 level. A high was formed near $1.39 and the price is now correcting gains.
It broke the $1.36 and $1.35 support levels. There was a break below the 23.6% Fib retracement level of the upward wave from the $1.21 swing low to $1.39 high.
ADA is now testing the $1.30 support and the 55 simple moving average (4-hours). There is also a major bullish trend line forming with support near $1.30 on the 4-hours chart. The trend line is close to the 50% Fib retracement level of the upward wave from the $1.21 swing low to $1.39 high.
The next major support on the downside is near the $1.258 level. Any more losses could lead the price towards the main breakdown support at $1.20.
On the upside, an initial resistance is near the $1.32 level. The first major resistance is now near the $1.35 level. The main hurdle is still near the $1.40 level. A clear close above the $1.40 level could spark a decent move towards the $1.50 level.
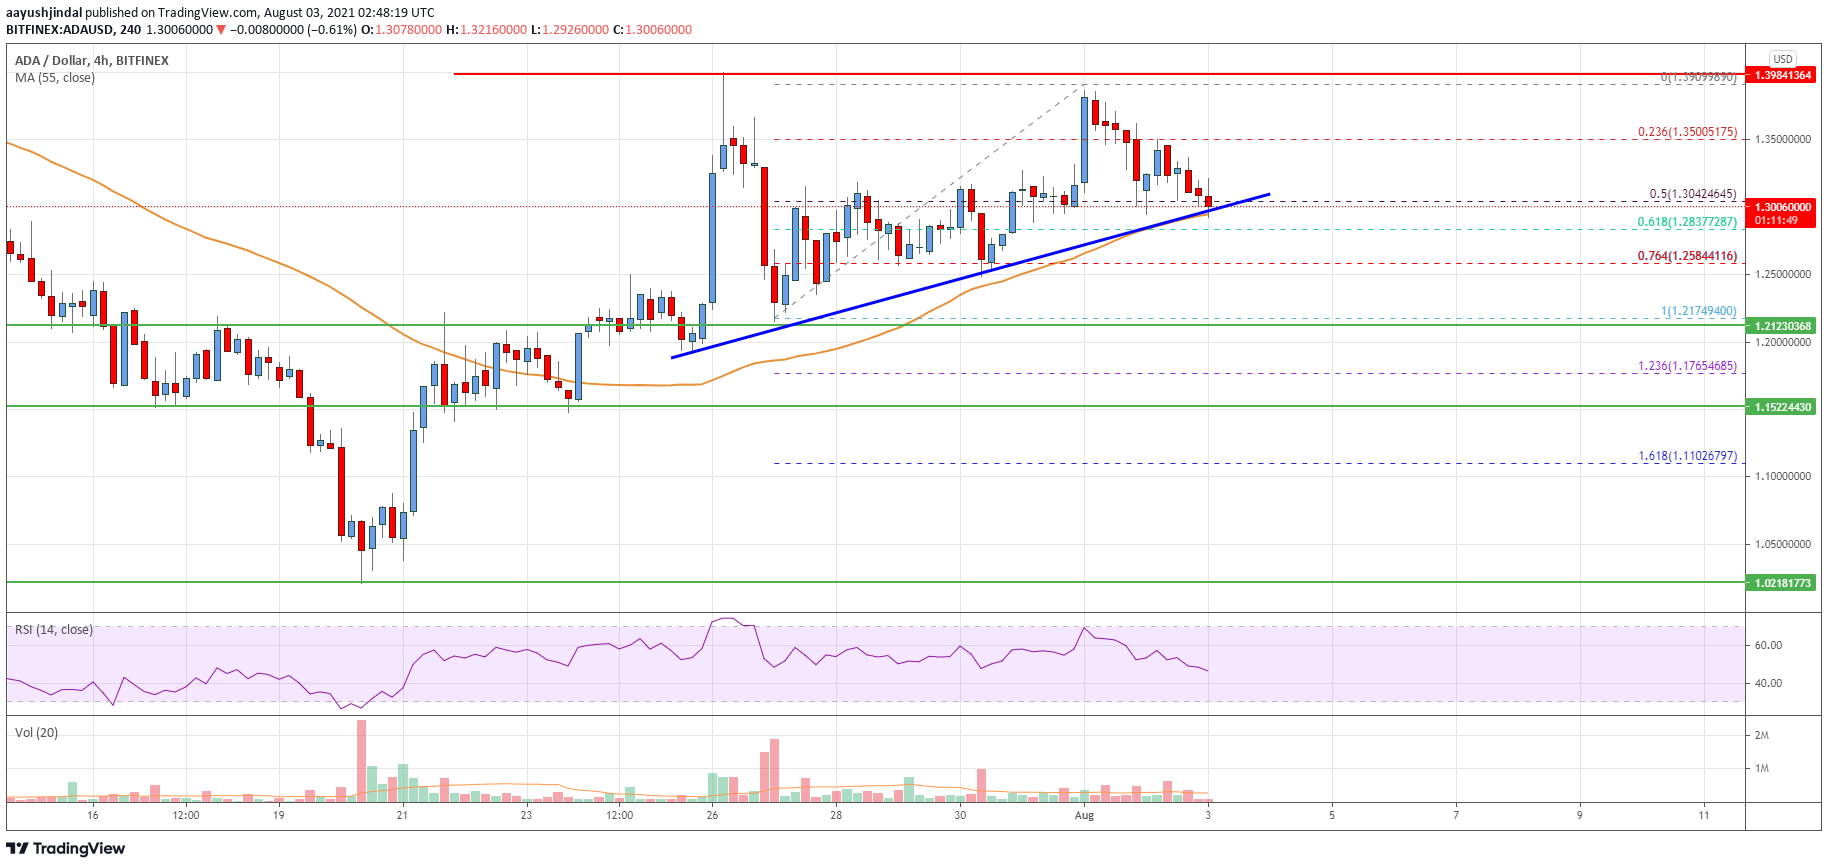
The chart indicates that ADA price is clearly testing the $1.30 support and the 55 simple moving average (4-hours). Overall, the price could extend its decline, but the bulls might protect the $1.20 and $1.15 support levels.
Technical Indicators
4 hours MACD – The MACD for ADA/USD is now gaining pace in the bearish zone.
4 hours RSI – The RSI for ADA/USD is now just below the 50 level.
Key Support Levels – $1.30 and $1.20.
Key Resistance Levels – $1.35 and $1.40.


Leave a Reply
You must be logged in to post a comment.