
- ADA price is trading in a bearish zone below the $0.30 support zone against the US Dollar.
- The price is now trading above $0.26 and the 55 simple moving average (4-hours).
- There is a major bearish trend line forming with resistance near $0.285 on the 4-hours chart (data feed via Kraken).
- The price could continue to move down if it stays below the $0.2850 resistance zone.
Cardano price is struggling below $0.285 against the US Dollar, similar to bitcoin. ADA price could start a recovery wave if it clears the $0.275 and $0.285 resistance levels.
Cardano Price Analysis
Earlier this month, cardano price saw a fresh decline below the $0.300 zone against the US Dollar. The ADA/USD pair declined below the $0.295 and $0.285 support levels.
The price even declined below the $0.265 support and the 55 simple moving average (4-hour). A low was formed near $0.2467 and the price is now consolidating losses. The price is now trading above $0.26 and the 55 simple moving average (4-hours).
On the upside, an immediate resistance is near the $0.265 zone. It is near the 23.6% Fib retracement level of the downward move from the $0.3290 swing high to $0.2467 low. The first major resistance is near the $0.275 level.
The next major resistance could be near the $0.285 zone. There is also a major bearish trend line forming with resistance near $0.285 on the 4-hours chart. The trend line is near the 50% Fib retracement level of the downward move from the $0.3290 swing high to $0.2467 low.
A clear upside break above the $0.285 level might send the price towards the $0.300 resistance. Any more gains could start a steady increase towards the $0.320 level.
On the downside, an immediate support is near the $0.260 level. The next major support is near the $0.250 level, below which the price may perhaps decline towards the $0.235 support level. Any more losses might call for a test of the $0.212 level.
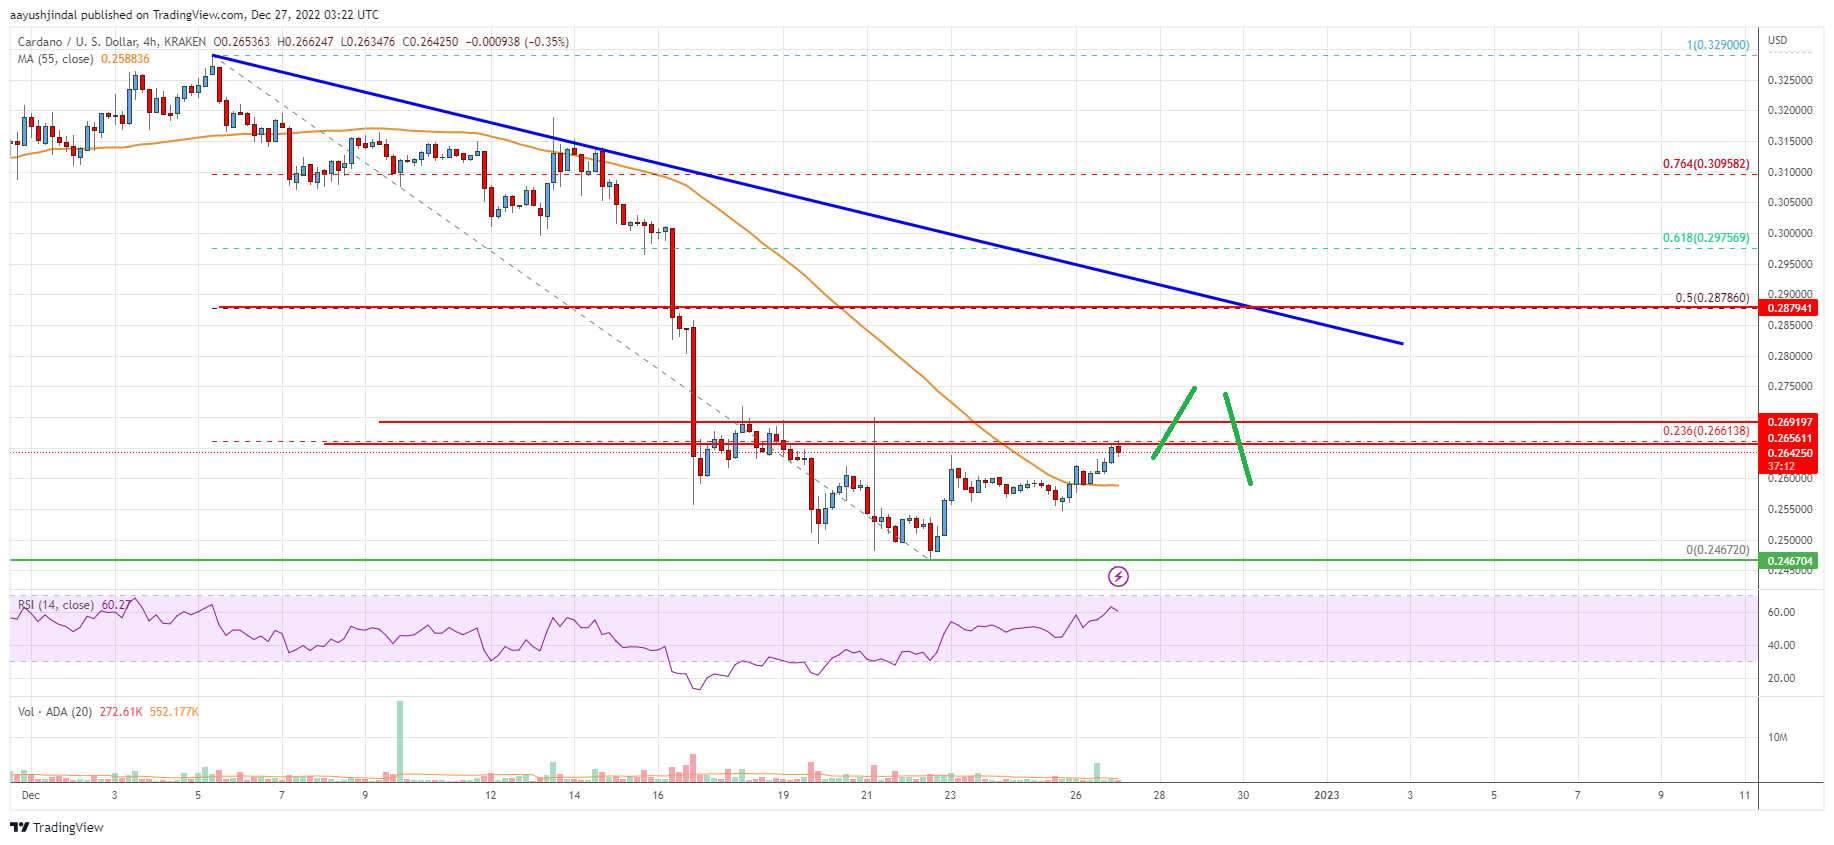
The chart indicates that ADA price is now trading above $0.260 and the 55 simple moving average (4-hours). Overall, the price could continue to move down if it stays below the $0.285 resistance zone.
Technical Indicators
4 hours MACD – The MACD for ADA/USD is now gaining pace in the bullish zone.
4 hours RSI – The RSI for ADA/USD is now above the 50 level.
Key Support Levels – $0.260 and $0.250.
Key Resistance Levels – $0.275 and $0.285.


Leave a Reply
You must be logged in to post a comment.